play icon for videos
← Academy
SOPACT ACADEMY · IMPACT MEASUREMENT & REPORTING · FOUNDATION

What Is Impact Measurement and Reporting?

Define the change that matters, align organization and funder context, and turn connected evidence into reporting that people can inspect, trust, and act on.

Impact Measurement and Reporting is the practice of defining the change that matters, deciding what evidence would support it, interpreting that evidence responsibly, and communicating what the organization should do next. The work is embedded when those definitions and evidence requirements shape everyday Case, Grant, Portfolio, and Connected Data workflows. The report is an output of the practice—not a separate project reconstructed at the deadline.

Key takeaways

  • Impact measurement begins with a decision and intended change, not a list of metrics.
  • The organization's evidence model and the funder's context should be aligned without allowing either to erase the other.
  • Frameworks and standards organize meaning; they do not create evidence by themselves.
  • Connected Data Intelligence keeps the required evidence usable. Impact Measurement & Reporting determines what it means and what can be claimed.
  • A credible report separates supported findings, uncertainty, limitations, contribution, and next action.

What Impact Measurement and Reporting is

Impact measurement explains what changed, for whom, why it matters, how the organization knows, and what remains uncertain. Reporting turns that governed interpretation into a view appropriate for a funder, donor, board, investor, partner, or program team.

“Embedded” describes where the discipline lives. Outcome definitions influence intake and follow-up. A Theory of Change influences the questions asked during delivery. Funder requirements are translated into collectable evidence before the report is due. Qualitative evidence is reviewed alongside numbers while the program can still respond.

The measurement and reporting lifecycle in eight steps

From an intended change to a report people can use
1
Name the decisionDefine what the program, funder, board, investor, or partner must understand or decide.
2
Explain the intended changeUse a Theory of Change, Logic Model, logframe, results framework, or clear strategy narrative.
3
Build the organization evidence modelState the outcomes, affected groups, assumptions, existing evidence, and unresolved questions.
4
Understand the funder contextRead requirements, conversations, research, language, standards, and the decision behind the report.
5
Define every important measureRecord meaning, unit, calculation, population, period, source, owner, and disaggregation.
6
Map requirements to evidencePlace each evidence item in the real workflow where it can be created accurately.
7
Interpret the complete recordRead numbers, participant voice, documents, change over time, gaps, contradictions, and limitations together.
8
Report, decide, and reviseTrace important claims to evidence, tailor the audience view, record the decision, and improve the next cycle.

How the two supporting courses divide the work

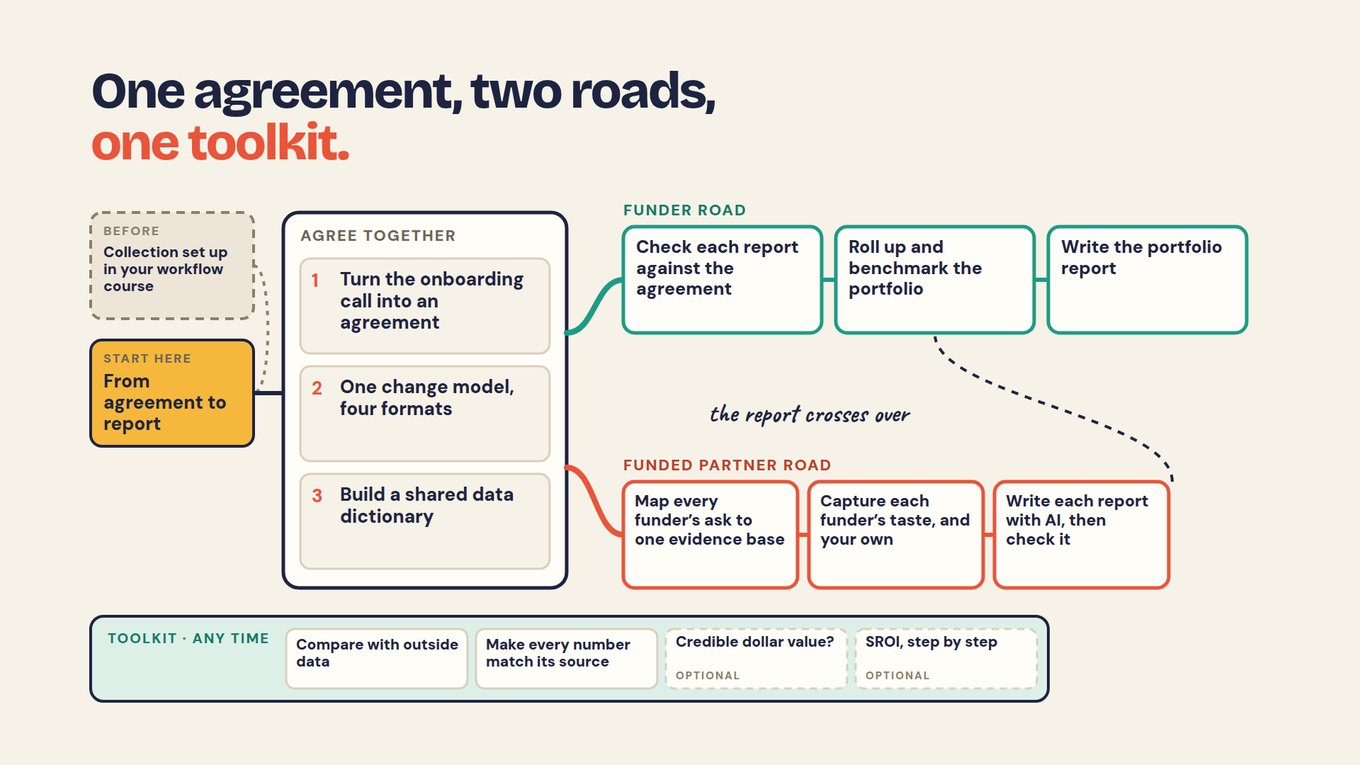
Impact Measurement and Reporting should not become a course about moving files or matching records. Connected Data Intelligence should not decide the organization's outcome logic or write an impact claim. The handoff is the Evidence Map.

Impact Measurement & Reporting

Defines the decision, intended change, frameworks, outcomes, measures, standards, and evidence requirements.

Connected Data Intelligence

Defines the continuing record, collection moment, channel, identifier, source, timestamp, access, and history.

Shared artifact: the Evidence Map

The process is circular. Better definitions improve collection. New evidence reveals missing assumptions. Program learning changes the next measurement cycle.

Frameworks help organize judgment; they do not replace it

A Theory of Change explains why activities are expected to contribute to change. A Logic Model organizes inputs, activities, outputs, and outcomes. A logframe or results framework adds indicators, sources, assumptions, and responsibilities. The Five Dimensions help examine what, who, how much, contribution, and risk. SROI adds a monetary valuation method.

These are not competing software categories, and an organization does not need every framework. Choose the lightest structure that supports the real decision. The Academy provides practical chapters on building a Theory of Change you can test, building a usable Logic Model, and using the Five Dimensions to test the evidence—but a framework only tells you where a number belongs, not how to read it, so the unit that actually decides whether two organizations mean the same thing by the same word is context, which is what the next two sections build.

Watch (6:07): why two organizations can file the same framework-approved number and still mean different things by it, and the four layers of context—data, framework, audience, expression—that decide the reading.

Alignment begins with two bodies of context

The Organization Evidence Model records the change the organization is responsible for, the people affected, assumptions, definitions, evidence already available, and unresolved questions. The Funder Context Profile records the funder's priorities, agreements, conversations, research, language, required disaggregation, standards, evidence expectations, and the decision the next report must support.

An Alignment Crosswalk then marks each relationship as aligned, partial, missing, or in conflict. Alignment does not mean surrendering the organization's judgment or inventing an indicator to fill an empty reporting box. It makes agreement and disagreement visible before collection begins.

Give every important number one governed definition

Terms such as “participant served,” “job placed,” “business supported,” or “income improved” can hide different populations, time windows, calculations, and evidence thresholds. A practical data dictionary records the outcome or indicator name, plain-language definition, unit, population, calculation, reporting period, source, owner, disaggregation, and standards mapping.

SDGs, IRIS+, GRI, disability codes, or a funder's custom metric library can then be mapped without silently changing the organization's measure. Record where a standard fits, partly fits, or does not fit.

Turn reporting requirements into evidence created during the work

A report should not trigger a new search for evidence. Translate each required section, figure, explanation, and limitation into an item on the Evidence Map. Then place it at the moment it can be observed accurately: application, intake, baseline, service delivery, attendance, coach note, partner update, midline, exit, interview, or follow-up.

The Connected Data course handles how those moments and sources stay joined. The measurement course handles why the evidence is needed, how it is defined, and what interpretation is responsible. See how to turn reporting requirements into collectable evidence.

Read numbers, voice, documents, and change over time together

A number can show that attendance fell. Participant comments, mentor notes, interviews, and follow-up can explain whether transport, financial hardship, safety, scheduling, care responsibilities, program fit, or another condition contributed. The interpretation should distinguish what participants said, what the program observed, and what remains unknown.

Qualitative evidence should not be reduced to decorative quotations. Themes need a stated method and source passages. Quantitative change needs clear populations, periods, missingness, and calculations. Longitudinal findings require the same person or organization to remain connected across waves.

A report must separate evidence, interpretation, and claim

For every important result, show the definition, calculation, source, reporting period, population, exclusions, and supporting qualitative evidence. Then explain the interpretation and its limitations. Attribution, contribution, deadweight, displacement, and drop-off should be documented when they are relevant rather than hidden inside a confident sentence or ratio.

Different audiences may need different views of the same governed evidence. A program team needs intervention detail. A funder may need progress against the agreement and a transparent explanation of variance. A board needs decisions, risks, and implications. The evidence should remain stable even when the presentation changes.

Watch the complete workflow

The walkthrough shows how framework, reporting requirements, collection moments, mentor notes, follow-up evidence, and traceable reporting fit together. The important test is not whether AI can write fluent prose. It is whether the team can inspect the definition, calculation, source, missing evidence, and human judgment behind the result.

What Sopact Sense adds to the method

The method can begin with documents, a crosswalk, a data dictionary, and a carefully managed evidence map. Sopact Sense becomes useful when the organization must repeat the method across programs, funders, partners, reporting periods, or portfolios. It can hold the governing context, connect it to incoming evidence, prepare source-linked answers, and retain the query and evidence trail for review.

AI can retrieve, compare, classify, summarize, and prepare a draft. People remain responsible for outcome logic, ethical interpretation, standards choices, attribution, sensitive conclusions, and final decisions. A fluent answer is not accepted merely because it sounds plausible.

Where Impact Measurement and Reporting fits—and where it does not

Strong fit

  • Programs that need learning and funder reporting from the same evidence
  • Organizations aligning their strategy with several funding contexts
  • Foundations and funds governing outcome definitions across partners
  • Teams choosing or combining frameworks and standards
  • Reports that must trace important figures and claims to evidence

Not the primary fit

  • A compliance form with no outcome or learning question
  • A dashboard redesign before definitions and sources are governed
  • A universal metric list imposed regardless of program context
  • Automatic attribution or valuation with hidden assumptions
  • Reporting that uses participant stories without consent or context

The one thing to do this week

Choose one real reporting or program decision. Create three columns: organization outcome, audience requirement or decision, and evidence available now. Mark every row aligned, partial, missing, or in conflict. For one missing or partial row, identify the collection moment and source that could repair it. That is your first Evidence Map.

Frequently asked questions

What is Impact Measurement and Reporting?

It is the practice of defining intended change, governing outcomes and measures, collecting appropriate evidence, interpreting findings and limitations, and communicating what a program, funder, board, investor, or partner should understand or decide.

What does “embedded” impact measurement mean?

It means definitions and evidence requirements are built into the workflows that create the evidence. Measurement is reviewed during delivery and follow-up rather than reconstructed only when a report is due.

How is this different from Connected Data Intelligence?

Connected Data Intelligence manages the evidence record: sources, identity, collection moments, time, access, and history. Impact Measurement and Reporting governs intended change, frameworks, definitions, interpretation, claims, and audience-specific reporting.

Which impact framework should an organization use?

Use the lightest framework that supports the decision. A Theory of Change explains causal logic; a Logic Model organizes the program chain; a logframe or results framework adds implementation detail; the Five Dimensions test impact evidence; SROI adds valuation.

Do funder metrics replace the organization's outcomes?

No. Build an Alignment Crosswalk between the organization's Evidence Model and the funder's Context Profile. Keep partial matches, missing evidence, and genuine conflicts visible instead of forcing every outcome into a funder's vocabulary.

Can the same evidence support several funders?

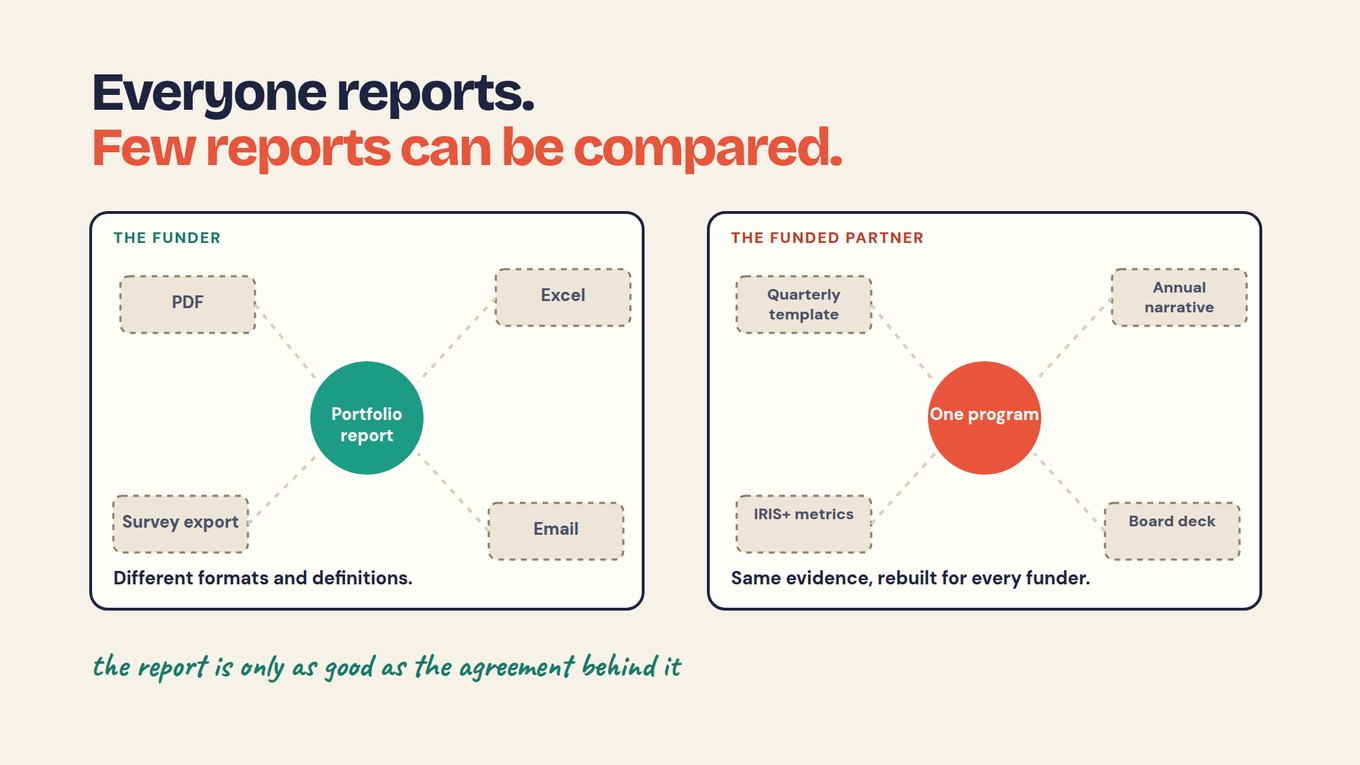
Yes, when the underlying definitions and source evidence remain governed. Each funder may receive an audience-specific view, but the organization should not silently change the meaning of a measure to fit a template.

How should AI be used in impact reporting?

AI can retrieve evidence, compare requirements, identify themes, check gaps, and prepare source-linked drafts. People should approve definitions, inspect evidence, assess uncertainty and attribution, protect sensitive information, and make the final decision.

Where should a team start?

Start with one real decision, the organization's intended outcome, one audience requirement, and the evidence available now. Build an Alignment Crosswalk and Evidence Map before redesigning every metric or report.

Continue the course: Build a Theory of Change you can test, build the Organization Evidence Model, or use Connected Data Intelligence when sources, identity, collection, or history are the immediate problem.

Ready to try it for yourself?

ChatGPT, Claude, and Gemini are fine for a quick test — but not for an answer you'll put in front of a funder or board. When it has to hold up, run it in Sopact Sense.

See impact evidence in Sopact →
The Loop
The Loop — the method in one read
the-loop
Loop
The method
0
One continuous method for reliable, traceable AI reporting across case, application, grant, and program workflows: collect clean, analyze on arrival, and improve in time.
Teams running cases, applications, grants, or programs that need AI-assisted reporting they can reproduce, trace to source evidence, and act on before the cycle ends.
What Is Case Intelligence?
what-is-case-intelligence
Case
Foundation
1
One current, traceable record for each person—connecting intake, services, notes, surveys, documents, outcomes, decisions, and follow-up.
Workforce and training · Youth and mentoring · Case management · Scholarships · Accelerators · Education · Nonprofit programs
What Is Grant Intelligence?
what-is-grant-intelligence
Grant
Foundation
1
One connected evidence record from application and committee review through the awarded grant, grantee reporting, renewal, and board accountability.
Foundations and grantmakers · Public grant programs · Scholarships and fellowships · Accelerators
What Is Portfolio Intelligence?
what-is-portfolio-intelligence
Portfolio
Strategy
1
A source-linked portfolio view that connects each investee or grantee's agreed plan, reporting cadence, evidence, risks, and results.
Impact funds and investors · Foundations with grant portfolios · Family offices · Blended-finance vehicles
What Is Connected Data Intelligence?
connected-data-intelligence
Feedback
Foundation
1
Keep evidence from surveys, files, notes, documents, systems, sites, and reporting periods connected to one continuing record.
Multi-program nonprofits · Member and chapter networks · Research associations · Training and coaching teams · Organizations with scattered evidence
What Is Impact Measurement and Reporting?
embedded-impact-measurement
Reporting
Align
1
Define intended change, align organization and funder context, govern measures, interpret evidence, and produce traceable reports for decisions.
Program and impact teams · MEL leads · Funders and donors · Foundations · Impact funds · Organizations building rigorous impact reports
The Loop Methodology
Methodology — continuous, not annual
loop-methodology
Loop
The method
1
The continuous collect–analyze–improve cycle, adopted as an experiment: start with the step that already pays and add one data-collection step at a time.
Teams tired of rebuilding spreadsheets and forms who want a measurement system that compounds instead of resetting.
How to Build a Theory of Change with AI: Prompts, Workflow & Examples
Build a Theory of Change You Can Test
how-to-build-a-theory-of-change
Reporting
Align
2
How Do You Onboard a Portfolio and Track Results?
Onboard a Portfolio & Lock the Impact Agreement
onboard-portfolio-lock-impact-agreement-track-results
Portfolio
Data Dictionary
2
The Loop: Reliability
Reliability — the same answer twice
loop-reliability
Loop
The method
2
Determinism as a feature: the same question over the same data returns the same answer every run — the opposite of a generic AI chat that drifts.
Anyone who has watched a general AI tool give two different numbers for the same question and needs results they can stand behind.
How to Design a Fair Application and Selection Process
Design an Application Process
how-to-design-an-application-process
Grant
Foundation
2
Which Shape Is Your Data?
Which shape is your data?
which-shape-is-your-data
Feedback
Foundation
2
How Do You Build a Logic Model?
Build a Logic Model You Can Use
how-to-build-a-logic-model
Reporting
Align
3
How Do You Onboard a Grant or RFP Program?
Onboard a Grant or RFP Program
how-to-onboard-a-grant-rfp-program
Grant
Foundation
3
Theory of Change to Data Collection: A Four-Step Workflow
Turn a Theory of Change into a Data-Collection Workflow
theory-of-change-to-data-collection-workflow
Case
Foundation
3
How Do You Map Portfolio Data to IRIS+, GRI, and ESRS?
One Data Dictionary & Standards Mapping (IRIS+ / GRI / ESRS / CSRD)
portfolio-data-dictionary-standards-mapping
Portfolio
Chapters
3
The Loop: Traceability & Transparency
Traceability & Transparency
loop-traceability
Loop
The method
3
Every figure links back to the exact response, note, or document it came from — a full audit trail from headline result to raw evidence.
Teams whose numbers get scrutinized — by funders, boards, auditors, or standards — and who need to answer where did this come from on the spot.
How Do You Change a Question Without Breaking the Record?
Change questions without breaking the record
change-questions-without-breaking-the-record
Feedback
Control
3
Versioning questions and rules so a programme team can improve the instrument mid-cycle without silently breaking the trend line.
Programme & MEL leads · Teams whose questionnaire has ossified · Anyone evaluating a platform where configuration is a purchased service
What Are the IMP Five Dimensions of Impact?
Use the Five Dimensions to Test the Evidence
five-dimensions-of-impact
Reporting
Align
4
How Do You Design a Grant Rubric and Eligibility Rules?
Design Your Rubric & Eligibility Rules
grant-rubric-eligibility-rules
Grant
Foundation
4
How Do You Frame Portfolio Outcomes Over Outputs?
Frame Outcomes Over Outputs at Portfolio Level
frame-outcomes-portfolio-level
Portfolio
Chapters
4
The Loop: Flexibility
Flexibility — one method, four workflows
loop-flexibility
Loop
The method
4
The same collect–analyze–improve cycle, shaped to four kinds of impact work — case, grant, portfolio, and feedback — each shown end to end.
Anyone deciding where the Loop fits their work, who wants to see the full path from messy input to a report they can defend.
How Do You Collect Feedback Offline and in the Field?
Collect Feedback Offline & in the Field
collect-feedback-offline
Feedback
Connect
4
Capturing stakeholder feedback where there's no connectivity and syncing each answer to one continuing record — so field and multi-site programs keep a single identity from intake to endline.
Field & multi-site programs · Low-connectivity contexts · Nonprofits collecting in person
How Do You Design an Intake Form for a Baseline?
Design an Intake Form That Captures a Usable Baseline
intake-form-usable-baseline
Case
Nonprofit Track
5
What's the Difference Between Outcomes and Outputs?
Outcomes vs Outputs
frame-outcomes-over-outputs
Grant
Foundation
5
How Do You Do Pre-Investment Due Diligence?
Pre-Investment Due Diligence & Screening
pre-investment-due-diligence-screening
Portfolio
Chapters
5
The Loop Guarantee
The Guarantee — first workflow in 2 months
loop-guarantee
Loop
The method
5
How Do You Build an Organization Evidence Model?
Build the Organization Evidence Model
build-organization-evidence-model
Reporting
Align
5
How Do You Use Documents as Evidence?
Read documents as evidence
read-documents-as-evidence
Feedback
Connect
5
How to Clean Open-Ended Survey Responses
Clean Open-Ended Responses at the Source
clean-open-ended-survey-responses
Feedback
Clean
6
How Do You Spot At-Risk Participants Mid-Program?
Spot At-Risk Participants Mid-Program
spot-at-risk-participants-mid-program
Case
Nonprofit Track
6
How to Write a Nonprofit Grant Application: Template and Example
Grant Application for Nonprofits
grant-application-for-nonprofit-organizations
Grant
Foundation
6
How Do You Collect Investee Reporting Without Burden?
Collect Standardized Reporting from Every Investee, Without Burden
collect-investee-reporting-without-burden
Portfolio
Chapters
6
How Do You Build a Funder Context Profile?
Build a Sourced Funder Context Profile
build-funder-context-profile
Reporting
Align
6
How Do You Measure Change at Exit?
Measure Change at Exit (Not Just Completion)
measure-change-at-exit
Case
Nonprofit Track
7
How Do You Collect Applications Clean at the Source?
Collect Applications Clean at the Source
collect-applications-clean-at-source
Grant
Collect
7
How Do You Chase Missing Investee Data?
Chase Missing Investee Data — Automatically
chase-missing-investee-data
Portfolio
Chapters
7
How Do You Analyze Multilingual Feedback?
Analyze Multilingual Feedback
analyze-multilingual-feedback
Feedback
Clean
7
Cleaning and theming multilingual open-ended feedback across languages on one continuing record — every theme cited to the person's own words, with no manual translate-then-code step.
Multi-country programs · Multilingual survey data · Global networks & chapters
How Do You Define Measures the Organization and Funder Can Both Use?
Define Measures the Organization and Funder Can Both Use
define-impact-metrics-funders-want
Reporting
Align
7
How Do You Find Who Is Missing Survey Waves?
Survey attrition — who is missing waves
survey-attrition-longitudinal-studies
Feedback
Read
8
How to Catch At-Risk Participants Early with Mentor Notes
Catch At-Risk Participants Early with Mentor Notes
mentor-notes-early-warning
Case
Nonprofit Track
8
How Do You Reduce Applicant Burden?
Reduce Applicant Burden
reduce-applicant-burden-auto-clarification
Grant
Collect
8
How Do You Analyze Investee Reports?
Read Investee Reports Across Qual + Quant + Financial + Social
read-investee-reports-multi-signal
Portfolio
Chapters
8
How Do You Define an Impact Metric So Everyone Counts It the Same Way?
Give Every Number One Definition
one-definition-for-every-number
Reporting
Define
8
How Do You Connect Quantitative and Qualitative Data?
Connect Quantitative & Qualitative Data
connect-quantitative-qualitative-survey-data
Feedback
Read
9
How Do You Calculate SROI Live?
Calculate SROI — Live, Sourced, and Honest
calculate-sroi-live
Case
Nonprofit Track
9
How Do You Collect Grantee Reports Without Burden?
Collect Grantee Reports Without Burden
collect-grantee-reporting-without-burden
Grant
Collect
9
How Do You Track Investees Against the Impact Agreement?
Track Investees Against the Impact Agreement (Variance)
track-investees-impact-agreement-variance
Portfolio
Chapters
9
How Do You Turn Reporting Requirements Into Evidence You Can Collect?
Turn Requirements Into Collectable Evidence
turn-reporting-requirements-into-evidence
Reporting
Define
9
How to Analyze Pre and Post Survey Data
Analyze Pre / Mid / Post Data
analyze-pre-mid-post-survey-data
Feedback
Read
10
How to Report a Job-Training Program to Grant Funders
Turn a Cohort into a Funder Impact Report
job-training-grant-impact-report
Case
Nonprofit Track
10
How Do You Chase Missing Grantee Data?
Chase Missing Grantee Data
chase-missing-grantee-data
Grant
Collect
10
How Do You Monitor Portfolio Risk in Real Time?
Portfolio Risk Monitoring & Early-Warning Alerts
portfolio-risk-monitoring-alerts
Portfolio
Chapters
10
How Do You Collect Clean Evidence Inside the Workflow?
Collect Clean Evidence Inside the Workflow
collect-clean-data-at-the-source
Reporting
Embed
10
How Do You Analyze Longitudinal Survey Data?
Track One Person’s Change Across Years
analyze-longitudinal-survey-data
Feedback
Read
11
How Do You Turn a Job Description Into a Checklist?
Turn a Job Description into a Requirements Checklist
job-description-requirements-checklist
Case
Social Enterprise Track
11
How Do You Review Applications Without Reviewer Bias?
Review Without Reviewer Bias
review-applications-without-reviewer-bias
Grant
Analyze
11
Ask Your Whole Portfolio Anything (Claude + MCP)
ask-your-portfolio-anything
Portfolio
Chapters
11
How Do You Get Stable Results From Governed Data?
Get Stable Results From Governed Data
same-numbers-every-time
Reporting
Read
11
How Do You Analyze a Batch of Grant Applications?
Analyze a Whole Round
how-to-analyze-a-batch-of-grant-applications
Grant
Analyze
12
How Long Do Program Outcomes Last?
Measure how long outcomes last
measure-outcome-duration-drop-off
Feedback
Read
12
How Do You Score Candidate-Role Matches Without Bias?
Score Candidate–Role Matches Without Bias
score-candidate-role-matches-without-bias
Case
Social Enterprise Track
12
How Do You Trace Every Result Back to Its Evidence?
Trace Every Result Back to Its Evidence
where-every-number-came-from
Reporting
Read
12
How Do You Roll Up a Grant Portfolio?
Aggregate Outcomes Across the Portfolio
how-to-roll-up-a-grant-portfolio
Portfolio
Communicate
13
How to Report Job Placements to Impact Investors
Turn a Cohort into a Social-Enterprise Investor Report
job-placement-investor-impact-report
Case
Social Enterprise Track
13
How Do You Track Reviewer Conflicts of Interest?
Track Reviewer Conflicts of Interest
track-conflicts-of-interest-audit
Grant
Analyze
13
How Do You Write a Donor Report?
Design a Report for a Real Funding Decision
donor-report-funders-trust
Reporting
Decide
13
A practical, step-by-step track for building a donor or grant report funders trust — from the funder's decision back through metrics, clean data, and traceable numbers.
Program & grant managers who report to funders
What Should AI Be Allowed to See in Your Stakeholder Data?
What the assistant may see
what-the-assistant-may-see
Feedback
Prove
13
How Do You Write an Impact Narrative for a Funder?
Write a Cited Impact Narrative
impact-narrative-funder-report-cited
Feedback
Prove
14
How Do You Read a Grantee Report?
Read a Grantee Report
read-grantee-report-multi-signal
Grant
Analyze
14
How Do You Monetize Impact with SROI?
Monetize Impact with SROI Across Levels
monetize-impact-sroi-across-levels
Portfolio
Chapters
14
How Do You Get AI to Write a Funder Report?
Generate the Audience-Specific Report From Evidence
assistant-writes-the-funder-report
Reporting
Decide
14
How Do You Compute Grantee Variance?
Compute Grantee Variance
how-to-compute-grantee-variance
Grant
Analyze
15
How Do You Put a Dollar Value on Impact?
Add a Credible Dollar Value With SROI
credible-dollar-value-on-impact
Reporting
Optional method
15
How Do You Set Up a Study That Follows People for Years?
One person, followed for years
one-person-followed-for-years
Feedback
Shapes
15
How Do You Build an SROI Value Map?
Build an SROI Value Map
how-to-build-an-sroi-value-map
Reporting
Optional method
16
How Do You Track Budget and Actual Spend?
Track Budget vs Actual Spend
how-to-track-budget-invoices-actual-spend
Grant
Analyze
16
How Do You Collect Feedback From Several People About One Person?
Several people describing one person
several-people-describing-one-person
Feedback
Shapes
16
How Do You Pick a Financial Proxy for SROI?
Pick a Defensible Financial Proxy
how-to-pick-a-financial-proxy-for-sroi
Reporting
Optional method
17
How Do You Analyze Grantee Reporting Longitudinally?
Analyze Grantee Reporting Over Time
analyze-grantee-reporting-longitudinal
Grant
Analyze
17
How Do You Compare Investees When Each One Defines Its Metrics Differently?
Compare & Benchmark Investees
compare-benchmark-investees
Portfolio
Chapters
17
How Do You Report Across Programs That Were Designed Separately?
Many programs, one picture
many-programs-one-picture
Feedback
Shapes
17
How Do You Calculate the SROI Ratio?
Calculate the SROI Ratio With a Range
how-to-calculate-the-sroi-ratio
Reporting
Optional method
18
How Do You Read a 990 for Compliance?
Read a 990 for Compliance
how-to-read-a-990-for-compliance
Grant
Analyze
18
How Do You Build Dashboards and Compliance Reports?
Portfolio Dashboards & Geographic Mapping
dashboards-sroi-compliance-reports
Portfolio
Communicate
18
How Do You Run a Survey Across a Member Network?
A network where each member sees their own part
member-network-survey
Feedback
Shapes
18
Ask Your Whole Grant Round Anything (Assistant + MCP)
Ask Your Whole Grant Round Anything
ask-your-grant-round-anything
Grant
Analyze
19
How Do You Produce an LP and Board Impact Report?
Produce the LP / Board Impact Report — Live, Not Annual
portfolio-lp-board-impact-report
Portfolio
Chapters
19
How Do You Build a Grant Audit Trail?
Build a Grant Audit Trail
grant-audit-compliance-trail
Grant
Communicate
20
How Do You Connect Your Stack Without Lock-In?
Connect Your Stack Without Lock-In (Microsoft Dynamics, Power BI, Affinity, MCP)
portfolio-connect-your-stack
Portfolio
Chapters
20
How Do You Produce Grant Compliance Reports?
Produce Compliance Reports
grant-compliance-regulatory-reports
Grant
Communicate
21
How Do You Roll Grantees Into a Board Report?
Roll Grantees Into a Board Report
roll-grantees-funder-board-report
Grant
Communicate
22
How Do You Build Grant Dashboards and Maps?
Grant Dashboards & Maps
grant-dashboards-geographic-mapping
Grant
Communicate
23