


By Sopact · Updated September 12, 2026
Portfolio intelligence is a way to keep every investee or grantee’s plan, reporting, evidence, risks, and results connected—then view the whole portfolio without losing the source behind any number. A spreadsheet can list organizations and a dashboard can display totals. Portfolio intelligence helps a team understand whether agreed plans are being followed, which results can be compared, where evidence is missing, and what the portfolio can honestly claim.
Watch · 2 minutes 16 seconds
Portfolio reporting from every source
Every source in, every investor’s report out. CRM, diligence, investee surveys, documents and email — one connected record, personalized reporting per recipient.
Key takeaways
- The unit is one investee or grantee within a portfolio, not an isolated spreadsheet row.
- The impact plan should be drafted from diligence and agreed with the funded organization before reporting begins.
- Different organizations can keep relevant measures while sharing enough definitions for an honest portfolio view.
- Every aggregate figure should open back to the organizations, reporting periods, definitions, and evidence behind it.
- Measured, estimated, and missing results must remain visibly different.
What is portfolio intelligence?
Portfolio intelligence connects the evidence from each funded relationship to the decisions made across the whole portfolio. For an impact investor, that relationship may begin in an application or diligence file and continue through the term sheet, impact agreement, quarterly reports, annual review, and exit. For a foundation, it may begin with a grant application and continue through onboarding, progress reports, board reporting, renewal, and close.
The aim is not to force every organization to use identical metrics. It is to make the differences explicit and governed. Each organization can have an agreed plan that fits its work. Shared definitions then make selected results comparable, while source links preserve the context that aggregation usually removes.
Course starting point: This lesson is for investment, grant and impact teams responsible for reporting across funded organizations. Bring one reporting request and three recent investee or grantee reports. You will leave with an evidence map, a list of incompatible measures and the questions to settle during onboarding. No software setup is required.
The portfolio lifecycle in eight steps
The impact plan should not start from a blank document
When a grant or investment closes, the evidence that justified it often becomes a folder handed to another team. Someone rereads the diligence, writes an impact plan in a document, creates a separate collection form, and later tries to reconnect reported results to the original case for funding.
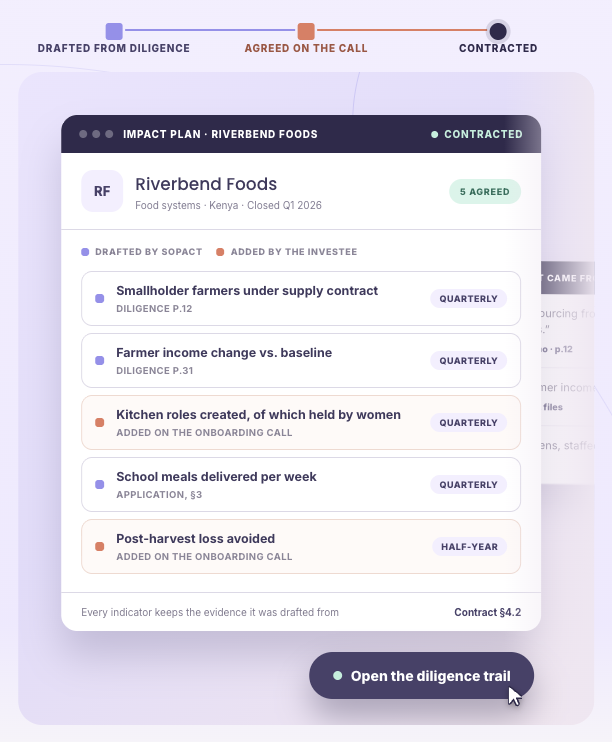
A better approach carries the evidence forward. Candidate outcomes and indicators can be drafted from the application, diligence memo, baseline, contract, and site notes. Each candidate keeps its source. The fund or foundation and the funded organization then agree on what matters, add what the documents missed, remove what is not useful, and set a realistic cadence.
The image is not a promise that software can design the plan alone. It shows the governance that matters: source, author, definition, reporting frequency, and agreement are visible. The organization being measured has a voice in the plan.
How do you evaluate a portfolio intelligence tool?
| Test with your own records | What to ask the team to demonstrate | What a useful result contains |
|---|---|---|
| Collect a quarterly update | Submit a metric, narrative and supporting file for the same investee | One reporting period and organization, with the original evidence accessible |
| Check a contradiction | Provide two different values for the same measure and period | A visible discrepancy and review step; no silent choice of a preferred value |
| Compare definitions | Use similar labels with different populations or time boundaries | An explanation of which values can be combined and which need clarification |
| Trace an answer | Ask for one portfolio total and open its contributing records | Source, date, calculation, definition version and missing organizations |
| Control access and corrections | Change a value and test two roles with different permissions | An auditable revision and appropriate access to the underlying evidence |
One shared dictionary does not mean one identical plan
A data dictionary records the agreed definition, unit, calculation and population for a measure, together with ownership and any standards mapping. It makes differences visible; it does not by itself make submitted data correct. Each observation also needs its organization, reporting period, source and applicable definition version. A well-designed system can store those together. For example, temporary placements and sustained employment should remain separate even when both reports use the label “jobs created.”
Watch (6:07): what an agreed meaning still leaves open — a portfolio total that reads one way to a trustee and another to the program officer who has to act on it.
Portfolio teams need both levels. The organization-specific plan protects relevance; shared definitions identify which observations can be compared. Record the exact standard, metric identifier, version and mapping rationale when a funder requires one. Impact Frontiers’ Five Dimensions organize questions about what changed, who experienced it, how much, contribution and risk. They are not interchangeable with a metric catalog or a disclosure standard. Mapping a field does not establish regulatory compliance or prove impact. Continue with portfolio data dictionaries and standards mapping.
A portfolio answer must name its sources
Suppose a donor asks, “How many roles has the portfolio created for women this year?” A credible answer is not only a total. It shows which organizations are included, which agreed indicators contributed, which periods are covered, which organizations are missing, and what definition of a role was used.
That last point matters. Excluding an organization with an open report should be explicit. Otherwise, a clean-looking total can create false confidence. Portfolio intelligence makes the boundary visible so the reader understands what the number does—and does not—represent.
A practical example: thirty different reports, one defensible view
Illustrative example. An impact fund has thirty investees working in food systems, health, and livelihoods. Their agreements contain different outcomes and reporting schedules. One funder asks how many sustained income opportunities were created for women. The portfolio team should not search thirty PDFs and add every number containing the word “job.”
First, the team identifies the governed definition: paid roles or contracted income opportunities, held for the required period, with gender and reporting dates specified. Next, it maps compatible investee indicators to that definition. It excludes measures that count training attendance or temporary event work, flags investees whose current report is missing, and retains the narrative evidence that explains unexpected changes. The final answer includes the total, contributing organizations, definition, reporting window, excluded records, and source links.
This workflow is developed further in onboarding a portfolio and tracking results, rolling up a grant portfolio, and producing an LP or board impact report.
Practice: can three reports support one answer?
Fictional exercise. A board asks for women in paid full-time roles at June 30. Three organizations report values under a field called “jobs.” Treat the values as submitted evidence, not an approved total.
| Organization | Reported value | Actual definition | Review decision |
|---|---|---|---|
| A | 40 | Women in paid full-time roles on June 30 | Compatible, subject to source review |
| B | 60 | All temporary placements during January–June; gender not recorded | Not compatible; request the relevant breakdown if available |
| C | 25 | Women in paid full-time roles on March 31 | Prior-period evidence; June observation missing |
The three values do not support a June total of 125. The compatible submitted value is 40 from one of three organizations. That is reporting coverage of 1/3 organizations, not one-third of all employees and not an estimate of the full portfolio. State whether A’s evidence has been reviewed. If the board needs unique people across organizations, also resolve possible overlap before presenting a person count.
- Write the question, audience and reporting date at the top of your worksheet.
- For each source, record the organization ID, definition, period, submission date and review owner.
- Classify the observation as compatible, needs clarification, prior period or missing. Do not convert missing to zero.
- Draft a two-sentence answer with its coverage and limitations.
- Turn each unresolved difference into an onboarding question with an owner.
Check your work: Another reviewer should be able to reproduce the 40, explain why 60 and 25 were excluded, and find the relevant source without asking you. Save this worksheet for the next lesson.
Valuation requires visible assumptions
SROI and other valuation methods can help a portfolio express social value in monetary terms, but the ratio is only as credible as its evidence. Every outcome needs a quantity, financial proxy, source, and rationale. Deadweight, attribution, displacement, drop-off, discounting, and the reporting period must be documented. Sensitivity scenarios should show how the result changes when assumptions change.
Most importantly, measured results must stay separate from benchmarked estimates. If an investee did not report the required evidence, mark it missing. Do not turn the gap into a precise-looking number. The Academy chapter on portfolio SROI explains the calculation and its limits.
Qualitative evidence protects meaning
Portfolio reporting often becomes a race to standardize numbers. Yet interviews, report narratives, participant comments, site notes, and explanations from investees show why results changed and whether the same indicator means the same thing in practice. They can reveal implementation barriers, negative effects, and groups who are not benefiting.
The goal is not to replace quantitative evidence with stories. It is to read both together. A reported increase should stay connected to the definition, calculation, organization, period, and the field evidence that helps a reviewer interpret it.
Responsible AI drafts and traces; people agree and decide
AI can help extract passages from inherited files, propose candidate outcomes, classify evidence and draft a source-linked response when the workflow and source access support those tasks. Test its output against the documents. A plausible sentence is not verification. People still agree the plan, review contradictory evidence, decide whether measures are comparable and approve what the funder or board receives.
Access controls, data minimization, version history, and human review are essential. Sensitive investee or participant information should not be exposed simply because a portfolio query is convenient. A reliable answer shows its source and boundaries; it does not ask the reader to trust a fluent paragraph.
Where portfolio intelligence fits—and where it does not
Strong fit
- Impact funds and investors
- Foundations with many grantees
- Family offices with an impact mandate
- Development-finance and blended-finance portfolios
- Accelerator portfolios after selection
Not the primary fit
- A single program with no portfolio roll-up
- A purely financial portfolio with no impact commitment
- A one-time report with no ongoing evidence workflow
- Identical metrics imposed without partner agreement
- Automated valuation with hidden proxies or assumptions
The one thing to do this week
Choose one portfolio question that matters to a real decision. Take three funded organizations and try to answer it. Write down where definitions differ, where a reporting period is missing, and which figures cannot be opened back to their source. That small test will show whether the problem is collection, definitions, follow-up, or roll-up.
Frequently asked questions
What is portfolio intelligence?
Portfolio intelligence connects each investee or grantee’s agreed plan and evidence to a whole-portfolio view while preserving the source behind every result.
How is it different from portfolio management software?
Capabilities overlap. Evaluate whether a tool can collect linked reports, retain definitions and sources, expose gaps and support review across funded organizations. Test those tasks with your own records rather than relying on the category label.
Must every investee use the same metrics?
No. Each organization can keep relevant measures. A shared dictionary identifies which measures are compatible and how they map to portfolio outcomes or standards.
How do you handle missing portfolio data?
Mark it missing, show which organization and period are affected, follow up at the right cadence, and keep the gap visible in any aggregate answer.
Can qualitative evidence be rolled up?
Themes can be analyzed across reports, but quotes and interpretations should remain connected to their sources and should not be presented as counts without a defined method.
What makes a portfolio result defensible?
A clear definition, compatible contributing records, a stated reporting period, source links, documented exclusions, and visible assumptions or limitations.
Can portfolio intelligence support SROI?
Yes, when proxy sources, quantities, adjustments, attribution logic, discounting, and sensitivity assumptions are documented and measured results remain separate from estimates.
Where should a portfolio team start?
Start with one decision question and three organizations. Test whether the answer can be produced with consistent definitions and opened back to evidence.
Continue the course: Onboard a portfolio and track results → Then learn to monitor portfolio risk, ask the whole portfolio a question, and produce an LP or board impact report.
Turn the evidence into a readable report
Use How to Write an Impact Report for report structure, or browse report examples. These resources help with presentation; the evidence map determines what the report can responsibly say.
Watch the portfolio demonstration on YouTube · Browse the Loop video library