play icon for videos
← Academy
Sopact Academy · Measurement & reporting · Chapter 5

Roll up and benchmark portfolio results

Each partner report has been checked against the agreement, and a few numbers are still waiting on answers. Now you need a portfolio total you can defend, and perhaps an outside number to compare it with.

Academy / Measurement & reporting

Chapter 5 of 13 · Funder road · About 15 minutes

Roll up and benchmark portfolio results

Each partner report has been checked against the agreement, and a few numbers are still waiting on answers. Now you need a portfolio total you can defend, and perhaps an outside number to compare it with.

You will learn: how to add up only what shares a definition, show held numbers in the open, split results by who was served, and add a benchmark only when it counts the same thing.

Who this is for: the funder, once partner reports have been checked against the agreement. You bring each partner's checked numbers, the gap log with any questions still open, and the shared data dictionary.

On this page: What adds up · Held numbers · Who was served · Benchmarks · Many partners · Checklist · Try it · Questions

Which partner numbers can you add up?

In short: Only numbers that share a definition. A total is only honest if every part means the same thing, so anything counted differently waits until the partner clarifies it.

After the check in the previous chapter, each partner's numbers carry a status. Those marked "matches" are ready to add; everything else is held.

Workforce fund example · fictional

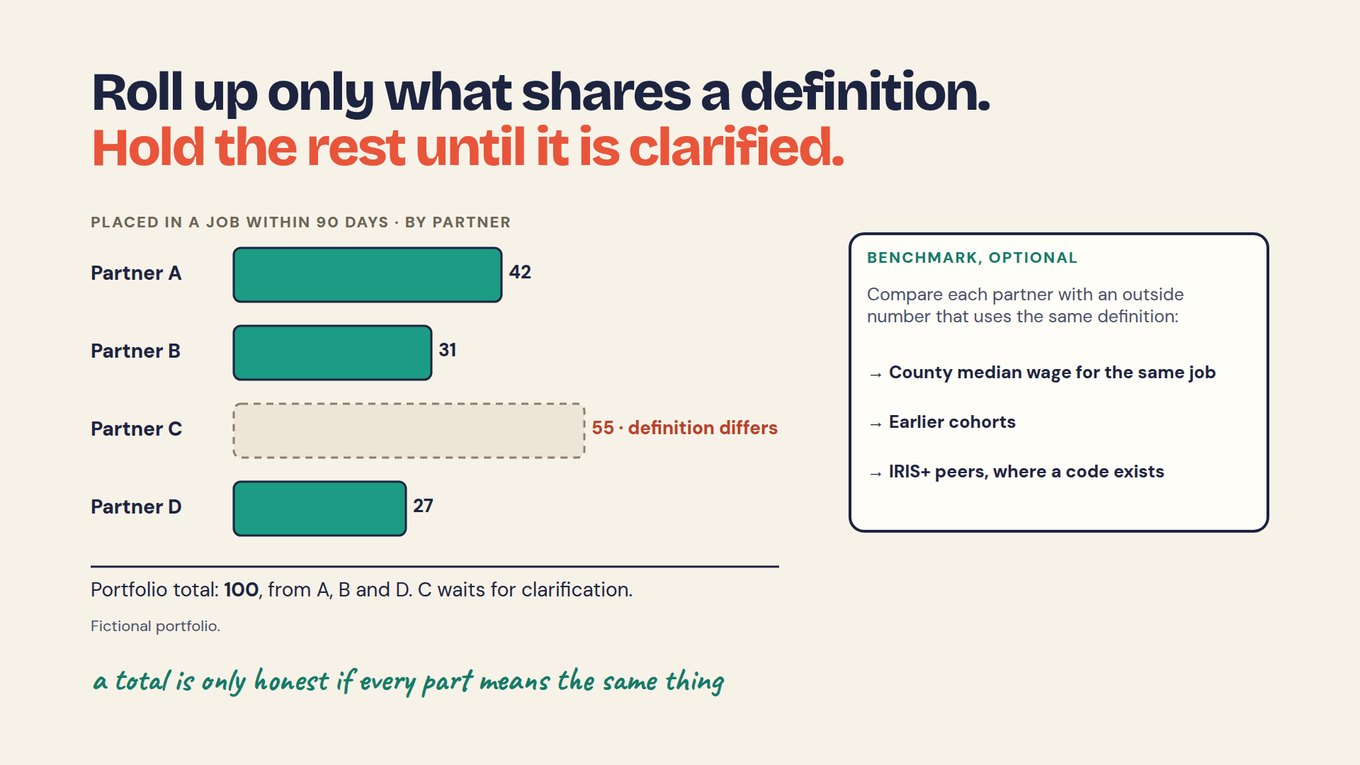
Placed in a job within 90 days of exit: Partner A 42, Partner B 31, Partner D 27. Portfolio total: 42 + 31 + 27 = 100, from A, B and D. Partner C reported 55, but counted placements within six months, so its number is held until C confirms the 90-day count.

Slide titled 'Roll up only what shares a definition. Hold the rest until it is clarified.' A bar chart of people placed in a job within 90 days by partner, for a fictional portfolio: Partner A 42, Partner B 31, Partner D 27, and Partner C shown as a dashed, unfilled bar labelled 55, definition differs. Below the chart: Portfolio total 100, from A, B and D; C waits for clarification. A side box headed Benchmark, optional, says to compare each partner with an outside number that uses the same definition: county median wage for the same job, earlier cohorts, IRIS+ peers where a code exists. A handwritten note reads: a total is only honest if every part means the same thing.
The portfolio total counts only the three partners using the agreed 90-day definition; Partner C's 55 waits.

Never add a held number silently. A total of 155 looks like a better result, but it mixes two measures, and the first board member who asks "within how long?" will find it. When C answers, its 90-day count joins the total, and the gap log records when and why the total changed.

How do you show a held number without hiding it?

In short: Put it in the report beside the total, with one line on why it is held and what you have asked. Leaving it out hides a partner's work; adding it in hides a definition problem.

Hidden

"Placed in a job within 90 days: 155 people." Or "100 people", with Partner C left out and no note.

Shown

"Placed in a job within 90 days: 100 people, from Partners A, B and D. Partner C reported 55 placements within six months; we have asked for its 90-day count and will add it when confirmed."

The note does three jobs. It tells the reader the total is incomplete, it shows that the portfolio checks definitions, and it credits Partner C for work already reported.

How do you break the roll-up down by who was served?

In short: Use the breakdown already written in the data dictionary, and split only where every partner collected the same categories. A breakdown with mismatched categories is another held number.

The dictionary row for enrolled sets the Who dimension, one of the Five Dimensions of Impact. Because every partner agreed to the same categories at the start, the portfolio's enrolled count can be split the same way.

DICTIONARY ROW · FICTIONAL EXAMPLE

MetricTotal clients enrolled
DefinitionUnique trainees in the reporting period, not sessions
DimensionHow much · Who (by gender, age, disability)
StandardIRIS+ PI4060 "Client Individuals: Total"
Roll-upAdd across partners, split by the same Who categories

Check the categories before you add. If one partner records age in bands and another records date of birth, the numbers cannot share a row until someone maps them; where a category is blank, report it as "not recorded", not as zero.

Show the denominator beside every rate. "100 placed within 90 days" means more beside the number who completed training at A, B and D, and a percentage without its base invites the wrong comparison.

When is a benchmark worth adding?

In short: Only when an outside number uses the same definition as yours. Benchmarks are optional; they answer "compared with what?", and a benchmark that counts something slightly different does more harm than none.

BenchmarkSame definition meansFits
County median wage for the same jobHourly, same occupation, same countyStarting wage by track
Earlier cohortsSame partner, same agreed rule, earlier periodPlacement, retention
IRIS+ peers, where a code existsSame IRIS+ metric codeEnrolled (PI4060)

Compare each partner with its own outside number, not the portfolio with everything. One track's starting wage beside the county median for that occupation tells you something; a portfolio average beside an all-jobs median does not. Wage data by occupation and area comes from sources such as the Bureau of Labor Statistics, and metric codes from IRIS+.

The toolkit chapter Compare your results with outside data walks through finding a source, checking its definition and loading it beside your own.

Comparison is not ranking.

Partners serve different people in different places. A partner that places fewer people may work with people furthest from work, in a county with fewer jobs, so a lower number can reflect harder work, not weaker work. Use a comparison to start a conversation with the partner, never to rank without context.

How do funders keep a roll-up workable across many partners?

In short: Agree the definitions once, keep each partner's data separate, and link every total back to the reports it came from. The more partners you add, the more a shared dictionary matters.

Auroville International USA channels donor money to about 80 project partners, more than $1M a year. Partners apply, are approved and report every quarter, and the funder report is built from those reports. They define terms such as a "complete quarterly report" and a "clean-water beneficiary" across five water projects, so the same words count the same thing from project to project.

AHA Ventures, the investment arm of the American Heart Association, is growing its portfolio from 19 to more than 40 companies. Its head of impact drafts each company's logic model and data dictionary during the onboarding call, from the call itself, with Sopact Sense. At 19 companies a mismatched definition can be fixed by hand; past 40, the dictionary written at the start is what keeps the total honest.

ONE IDA persistent ID per partner or companyEvery report and follow-up lands on the same partner record, from the first form onward.
FOLDERSEach partner's or site's data kept separateEach team's AI Assistant sees only its folder's data; the portfolio owner sees aggregated results.
TRACEAnswers trace to recordsEvery line in an answer links to a record you can open, so a total can be checked partner by partner.

What Sopact Sense does for a roll-up today.

ASK ANY TOOL, INCLUDING OURS

Ask: "Add placements within 90 days across the partners whose reports match the agreed definition, list any partner held out and why, and show which report each number comes from." Any AI tool can answer this from a checked gap log; in Sopact Sense, the AI Assistant answers from the partners' records, with sources. A shared place for definitions, the dictionary and frameworks that the Assistant applies is coming soon.

What should you check before you publish a portfolio total?

In short: Six checks, one line each. If any answer is no, hold the number or add a note.

CheckAskIf no
DefinitionDoes every part use the agreed definition?Hold that part; ask the partner
PeriodDo all parts cover the same period?Hold it, or label the period
Unique peopleIs each person counted once, not per visit?Ask for a unique count
WhoWere the same categories collected everywhere?Split only where they match
DenominatorIs the base shown beside every rate?Add it, or drop the rate
SourceCan each part be traced to a partner report?Find the report first

Roll-up checklist. Keep it beside your portfolio sheet.

A roll-up also inherits every gap below it: if a dictionary definition was loose, the total is loose, and no benchmark repairs that. The next chapter, Write the portfolio report for your board or donors, turns the checked total, the held numbers and the partners' own words into a report.

Try it on your own portfolio

  1. Choose one metric that every partner reports, such as placements.
  2. List each partner's number with its status from the gap log.
  3. Add only the matches, and write each held number beside the total with a one-line note.
  4. Check the Who breakdown against the dictionary's categories before you split the total.
  5. If you want a benchmark, name one outside number with the same definition and where it comes from.
Check your reasoning

The total is 42 + 31 + 27 = 100, from A, B and D. Partner C's 55 appears on its own line with a note, neither in the total nor missing from the page. When C confirms, add its 90-day count, not 55; that count can be no higher than 55, because every placement within 90 days is also within six months. For a benchmark, the county median wage for the same job fits starting wage by track, but only for partners that split wage by track, which C has not yet done.

Questions teams ask

Why not add Partner C's 55 with a footnote?

Because a footnote does not change the total. Readers quote the headline, and 155 would travel into board minutes and donor emails without its footnote. Keep the total at 100, show 55 on its own line with the reason it is held, and add C's 90-day count once confirmed. That count can be no higher than 55, since every placement within 90 days also falls within six months.

Do we need a benchmark in every portfolio report?

No. The roll-up answers how much happened across the portfolio; a benchmark answers compared with what, and it earns its place only when an outside number uses the same definition. For many metrics none exists, and an earlier cohort from the same partner is the fairest comparison you have. A benchmark that counts something slightly different misleads more than it helps.

What if partners collect different demographic categories?

Map them to the dictionary's categories where the mapping is exact, such as single ages into age bands, and hold the rest. Show the Who breakdown only for partners whose categories match, and say which partners are included. Then write the categories into next year's agreement and intake forms, so the breakdown works for every partner from the first record.

Should we show partner-by-partner results to our board?

Show them when they help the board understand the portfolio, with context beside each: who the partner serves, where, and anything that makes its numbers hard to compare. Avoid a ranked league table. Partners serving people furthest from work will often show lower rates, and a ranking would reward partners for choosing whom they serve rather than for what they achieve.

How do we handle a partner that joins mid-year?

Include its numbers only for the periods it reported under the agreement, and label the total so readers know the portfolio changed. When you compare with last year, compare the same partners in both periods, or say plainly that the portfolio grew. A total that rises because a partner joined is not the same as a total that rises because more people found work.

Put this guide into practice.

Bring two or three partner reports. Roll up only what shares a definition and see what must be held.

Discuss your use case →
Prepare Data Governance Before Using AI
Prepare your data governance
nonprofit-data-governance-before-ai
Feedback
Foundation
Prepare an evidence register and a tested governance baseline before applying AI to program data.
How to Turn Findings into Action and Check What Changes
The Loop — the method in one read
the-loop
Loop
The method
0
One continuous method for reliable, traceable AI reporting across case, application, grant, and program workflows: collect clean, analyze on arrival, and improve in time.
For growing data collection, connected analysis and recurring reporting
What Is Case Intelligence?
what-is-case-intelligence
Case
Foundation
1
One current, traceable record for each person—connecting intake, services, notes, surveys, documents, outcomes, decisions, and follow-up.
Workforce and training · Youth and mentoring · Case management · Scholarships · Accelerators · Education · Nonprofit programs
What is grant intelligence?
What Is Grant Intelligence?
what-is-grant-intelligence
Grant
Foundation
1
One connected evidence record from application and committee review through the awarded grant, grantee reporting, renewal, and board accountability.
Foundations and grantmakers · Public grant programs · Scholarships and fellowships · Accelerators
What Is Portfolio Intelligence?
what-is-portfolio-intelligence
Portfolio
Strategy
1
A source-linked portfolio view that connects each investee or grantee's agreed plan, reporting cadence, evidence, risks, and results.
Impact funds and investors · Foundations with grant portfolios · Family offices · Blended-finance vehicles
What Is Connected Data Intelligence? Start Here Before You Add AI
What Is Connected Data Intelligence?
connected-data-intelligence
Feedback
Foundation
1
Keep evidence from surveys, files, notes, documents, systems, sites, and reporting periods connected to one continuing record.
For growing data collection, connected analysis and recurring reporting
Measurement and reporting: from agreement to report
embedded-impact-measurement
Reporting
Start here
1
Turn the onboarding call into a reporting agreement, share one data dictionary, and write reports funders can compare and check.
For funders and the organizations they fund
Build a repeatable collect, review and improve cycle
Methodology — continuous, not annual
loop-methodology
Loop
The method
1
The continuous collect–analyze–improve cycle, adopted as an experiment: start with the step that already pays and add one data-collection step at a time.
Teams tired of rebuilding spreadsheets and forms who want a measurement system that compounds instead of resetting.
How Do You Onboard a Portfolio and Track Results?
Agree the Portfolio Reporting Plan
onboard-portfolio-lock-impact-agreement-track-results
Portfolio
Data Dictionary
2
Test whether an AI-assisted result is repeatable and correct
Reliability — the same answer twice
loop-reliability
Loop
The method
2
Determinism as a feature: the same question over the same data returns the same answer every run — the opposite of a generic AI chat that drifts.
Anyone who has watched a general AI tool give two different numbers for the same question and needs results they can stand behind.
Design an application process around the decision, not the form
Design an Application Process
how-to-design-an-application-process
Grant
Foundation
2
How to Structure Stakeholder Data: Four Common Patterns
Choose your record structure
which-shape-is-your-data
Feedback
Foundation
2
Map the people, observations and relationships your workflow needs before collecting data.
Turn the onboarding call into a reporting agreement
onboarding-call-to-reporting-agreement
Reporting
Agree together
2
How to build a theory of change, then show it as a logic model, logframe or results framework
how-to-build-a-theory-of-change
Reporting
Agree together
3
How do you onboard a grant or RFP program?
Onboard a Grant or RFP Program
how-to-onboard-a-grant-rfp-program
Grant
Foundation
3
Turn your theory of change into a data-collection plan
Turn a Theory of Change into a Data-Collection Workflow
theory-of-change-to-data-collection-workflow
Case
Foundation
3
Build a portfolio data dictionary without forcing false comparisons
Map Portfolio Data to Reporting Standards
portfolio-data-dictionary-standards-mapping
Portfolio
Chapters
3
Keep a clear trail from a finding to its evidence
Traceability & Transparency
loop-traceability
Loop
The method
3
Every figure links back to the exact response, note, or document it came from — a full audit trail from headline result to raw evidence.
Teams whose numbers get scrutinized — by funders, boards, auditors, or standards — and who need to answer where did this come from on the spot.
Build Context: The Organization Evidence Model
Build the Organization Evidence Model
build-organization-evidence-model
Feedback
Foundation
3
How to Change Survey Questions Without Losing Comparability
Change questions with a clear history
change-questions-without-breaking-the-record
Feedback
Control
3
Create a question-change log and decide how old and new versions should appear in reports.
Programme & MEL leads · Teams whose questionnaire has ossified · Anyone evaluating a platform where configuration is a purchased service
How do you design a grant rubric and eligibility rules?
Design Your Rubric & Eligibility Rules
grant-rubric-eligibility-rules
Grant
Foundation
4
How to Measure Outcomes Across an Investment or Grant Portfolio
Frame Outcomes Over Outputs at Portfolio Level
frame-outcomes-portfolio-level
Portfolio
Chapters
4
Adapt the learning cycle to your workflow
Flexibility — one method, four workflows
loop-flexibility
Loop
The method
4
The same collect–analyze–improve cycle, shaped to four kinds of impact work — case, grant, portfolio, and feedback — each shown end to end.
Anyone deciding where the Loop fits their work, who wants to see the full path from messy input to a report they can defend.
How to Collect Feedback Offline and Keep Records Connected
Collect offline and reconcile the batch
collect-feedback-offline
Feedback
Connect
4
Build a field protocol and reconcile a test batch across devices, visits and delayed uploads.
Field & multi-site programs · Low-connectivity contexts · Nonprofits collecting in person
How Do You Design an Intake Form for a Baseline?
Design an Intake Form That Captures a Usable Baseline
intake-form-usable-baseline
Case
Nonprofit Track
5
Turn a proposed outcome into a reporting definition
Outcomes vs Outputs
frame-outcomes-over-outputs
Grant
Foundation
5
Impact Due Diligence: Review Evidence Before Investment
Pre-Investment Due Diligence & Screening
pre-investment-due-diligence-screening
Portfolio
Chapters
5
Plan and review your first workflow pilot
The Guarantee — first workflow in 2 months
loop-guarantee
Loop
The method
5
How to Analyze Documents as Evidence: Sources, Context and Review
Read documents as traceable evidence
read-documents-as-evidence
Feedback
Connect
5
Create a document register and reviewed findings with source locations, context and explicit exceptions.
Check each partner report against the agreement
check-partner-reports-against-agreement
Reporting
Funder road
5
How to Clean Open-Ended Survey Responses Without Losing Meaning
Clean responses and define the denominator
clean-open-ended-survey-responses
Feedback
Clean
6
Create a cleaning log, response-status table and reproducible report statement.
How to Review Participant Support Needs Mid-Program
Spot At-Risk Participants Mid-Program
spot-at-risk-participants-mid-program
Case
Nonprofit Track
6
How to Write a Nonprofit Grant Application: Template and Example
Grant Application for Nonprofits
grant-application-for-nonprofit-organizations
Grant
Foundation
6
Design quarterly portfolio reporting that investees can complete
Collect Investee Reporting Without Repeated Rework
collect-investee-reporting-without-burden
Portfolio
Chapters
6
Roll up and benchmark portfolio results
roll-up-and-benchmark-portfolio-results
Reporting
Funder road
6
How Do You Measure Change at Exit?
Measure Change at Exit (Not Just Completion)
measure-change-at-exit
Case
Nonprofit Track
7
How do you collect applications clean at the source?
Collect Applications Clean at the Source
collect-applications-clean-at-source
Grant
Collect
7
How to Follow Up on Missing Investee Data
chase-missing-investee-data
Portfolio
Chapters
7
How to Analyze Multilingual Feedback and Evaluate Software
Analyze and review multilingual feedback
analyze-multilingual-feedback
Feedback
Clean
7
Build a language review sheet and test software on original responses, translations, codes and reporting bases.
Multi-country programs · Multilingual survey data · Global networks & chapters
Write the portfolio report for your board or donors
write-the-portfolio-report
Reporting
Funder road
7
Survey Attrition in Longitudinal Studies: Track Missing Waves
Track missing waves and matched outcomes
survey-attrition-longitudinal-studies
Feedback
Read
8
Build a wave-status register, compare response groups and report paired change with coverage and limitations.
How to Use Mentor Notes to Review Participant Support
Use mentor notes for support review
mentor-notes-early-warning
Case
Nonprofit Track
8
How do you reduce applicant burden?
Reduce Applicant Burden
reduce-applicant-burden-auto-clarification
Grant
Collect
8
Find inconsistencies in portfolio returns before reporting
Analyze Investee Reports Across Sources
read-investee-reports-multi-signal
Portfolio
Chapters
8
Map every funder's ask to one evidence base
turn-reporting-requirements-into-evidence
Reporting
Funded partner road
8
How to Connect Quantitative and Qualitative Survey Data
Connect scores and comments
connect-quantitative-qualitative-survey-data
Feedback
Read
9
Build a linked analysis view and joint display, with clear groups, reporting bases and evidence limits.
How to Calculate SROI as New Evidence Arrives
Calculate SROI — Live, Sourced, and Honest
calculate-sroi-live
Case
Nonprofit Track
9
How to Collect Grantee Reports with Less Burden
Collect Grantee Reports Without Burden
collect-grantee-reporting-without-burden
Grant
Collect
9
Keep company, investment and reporting history connected
Track Results Against the Impact Agreement
track-investees-impact-agreement-variance
Portfolio
Chapters
9
Capture each funder's taste, and your own
capture-funder-taste
Reporting
Funded partner road
9
How to Analyze Pre, Mid and Post Survey Data
Analyze pre, mid and post surveys
analyze-pre-mid-post-survey-data
Feedback
Read
10
Build a matched pre/mid/post analysis, interpret score movement and retain clear rules for missing waves.
How to Report a Job-Training Program to Grant Funders
Turn a Cohort into a Funder Impact Report
job-training-grant-impact-report
Case
Nonprofit Track
10
How to Follow Up on Missing Grantee Data
Chase Missing Grantee Data
chase-missing-grantee-data
Grant
Collect
10
How to Build Useful Portfolio Impact Monitoring Alerts
Build Useful Portfolio Impact Alerts
portfolio-risk-monitoring-alerts
Portfolio
Chapters
10
Write each funder's report with AI, then check it
assistant-writes-the-funder-report
Reporting
Funded partner road
10
Draft from approved sources, check the claims, and save an accountable report version. Bring the brief from the previous lesson.
Program managers, grant leads and reporting teams
How to Analyze Longitudinal Survey Data
Analyze longitudinal survey data
analyze-longitudinal-survey-data
Feedback
Read
11
Build a continuing analysis record with clear time scales, observed trajectories and limits.
How to Turn a Job Description into a Requirements Checklist
Clarify employer requirements
job-description-requirements-checklist
Case
Social Enterprise Track
11
Review applications without reviewer bias: one rubric, read on arrival, people decide
Review Without Reviewer Bias
review-applications-without-reviewer-bias
Grant
Analyze
11
How to Ask AI Questions About Your Portfolio Data
Ask AI Questions About Portfolio Data
ask-your-portfolio-anything
Portfolio
Chapters
11
Compare your results with outside data: live queries and public datasets
compare-with-outside-data
Reporting
Toolkit
11
How do you analyze a batch of grant applications?
Analyze a Whole Round
how-to-analyze-a-batch-of-grant-applications
Grant
Analyze
12
How to Measure Outcome Duration and Drop-Off
Measure outcome duration and drop-off
measure-outcome-duration-drop-off
Feedback
Read
12
Build a dated outcome claim, distinguish missingness from outcome loss and test forecast assumptions.
How to Score Candidate–Role Matches with a Clear Rubric
Review candidate–role evidence
score-candidate-role-matches-without-bias
Case
Social Enterprise Track
12
Make every number in your report match its source
where-every-number-came-from
Reporting
Toolkit
12
How Do You Roll Up a Grant Portfolio?
Aggregate Outcomes Across a Grant Portfolio
how-to-roll-up-a-grant-portfolio
Portfolio
Chapters
13
How to Report Job Placements to Impact Investors
Turn a Cohort into a Social-Enterprise Investor Report
job-placement-investor-impact-report
Case
Social Enterprise Track
13
How do you track reviewer conflicts of interest?
Track Reviewer Conflicts of Interest
track-conflicts-of-interest-audit
Grant
Analyze
13
How to put a credible dollar value on your results
credible-dollar-value-on-impact
Reporting
Toolkit
13
Prepare a valuation brief. Decide what the evidence supports, what needs more work, and when an outcome account is enough.
Program, evaluation and investment teams considering social-value estimates
AI Data Access Controls: What Your Assistant May See
Control what the assistant can access
what-the-assistant-may-see
Feedback
Prove
13
Define task-specific access, test synthetic records and verify report-sharing boundaries.
How to calculate the SROI ratio, step by step: value map, financial proxies and adjustments
how-to-calculate-the-sroi-ratio
Reporting
Toolkit
14
Build a reproducible SROI calculation, test its assumptions and explain the result in a reviewed report.
Evaluation and reporting teams reviewing an SROI calculation
How to Write an Evidence-Based Impact Narrative for a Funder Report
Write a cited impact narrative
impact-narrative-funder-report-cited
Feedback
Prove
14
Build and check a report paragraph using a claim-and-source table, appropriate quotations and clear limitations.
How Do You Read a Grantee Report?
Read a Grantee Report
read-grantee-report-multi-signal
Grant
Analyze
14
How to Use SROI Across a Portfolio Without Double Counting
Use SROI Across a Portfolio
monetize-impact-sroi-across-levels
Portfolio
Chapters
14
How Do You Compute Grantee Variance?
Compute Grantee Variance
how-to-compute-grantee-variance
Grant
Analyze
15
Keep a person’s history connected across programs and staff changes
Follow one person over time
one-person-followed-for-years
Feedback
Shapes
15
Build a participant record that preserves episodes, dates, versions and missingness across repeated collection.
How do you track budget, invoices and actual spend for a grant?
Track Budget vs Actual Spend
how-to-track-budget-invoices-actual-spend
Grant
Analyze
16
Multi-Rater Feedback: Connect Perspectives and Protect Context
Connect several perspectives on one person
several-people-describing-one-person
Feedback
Shapes
16
Design subject-rater relationships, reporting rules and a tested multi-perspective feedback record.
How Do You Analyze Grantee Reporting Longitudinally?
Analyze Grantee Reporting Over Time
analyze-grantee-reporting-longitudinal
Grant
Analyze
17
How Do You Compare Investees When Each One Defines Its Metrics Differently?
Compare & Benchmark Investees
compare-benchmark-investees
Portfolio
Chapters
17
Cross-Program Reporting: Combine Results Without Losing Meaning
Combine evidence across programs
many-programs-one-picture
Feedback
Shapes
17
Build a defensible cross-program result with comparable measures, correct denominators and documented exclusions.
How to read Form 990 for a grant review
Read a 990 for Compliance
how-to-read-a-990-for-compliance
Grant
Analyze
18
How Do You Build Dashboards and Compliance Reports?
Build Dashboards and Reviewed Reports
dashboards-sroi-compliance-reports
Portfolio
Chapters
18
Pick One Question. Keep Every System You Have.
Run a member-network survey
member-network-survey
Feedback
Shapes
18
Design and test a member reporting cycle with continuing records, coverage checks and authorized results.
Ask your whole grant round anything (Assistant + MCP)
Ask Your Whole Grant Round Anything
ask-your-grant-round-anything
Grant
Analyze
19
Produce portfolio reports that trace back to approved evidence
Produce the LP and Board Impact Report
portfolio-lp-board-impact-report
Portfolio
Chapters
19
How do you build a grant audit trail?
Build a Grant Audit Trail
grant-audit-compliance-trail
Grant
Communicate
20
How Do You Connect Your Stack Without Lock-In?
Connect Systems and Test Data Portability
portfolio-connect-your-stack
Portfolio
Chapters
20
How do you produce grant compliance and regulatory reports?
Produce Compliance Reports
grant-compliance-regulatory-reports
Grant
Communicate
21
How Do You Roll Grantees Into a Board Report?
Roll Grantees Into a Board Report
roll-grantees-funder-board-report
Grant
Communicate
22
How Do You Build Grant Dashboards and Maps?
Grant Dashboards & Maps
grant-dashboards-geographic-mapping
Grant
Communicate
23