


Academy / Measurement & reporting
Course progress and additional readings
Measurement & reporting
You will learn: why the same question can return two different numbers, how to fix it with one definition, one source and a numbered source note per figure, and how to check an AI-drafted report line by line.
Who this is for: both roads, at any time. Funders about to send a portfolio report to the board, and funded partners about to send a report to a funder. Bring one report, or one draft, with the figures you are least sure of.
Why does the same question give two different numbers?
In short: because something between the records and the number changed: the export, the filter, the definition or the AI run. Neither answer is always wrong. The reader cannot tell which one to trust until you show how each was made.
A program lead exports enrollment in March and gets one count. The M&E lead exports it in April, with a date filter, and gets another. Both are honest. They were asked different questions without knowing it.
| What changed | What happens | The fix |
|---|---|---|
| The export | A spreadsheet saved on a different day holds different records | One source per metric, dated |
| The filter | One person drops incomplete rows, another keeps them | Write the filter in the definition |
| The definition | "Placed" means 90 days to one partner, six months to another | One dictionary entry |
| The AI run | A new chat reads the files again and counts a little differently | Count from stored records; open the record behind each number |
The last row is new. Ask an AI tool the same question twice and it may read the files differently each time. That is fine for a first look. It is not fine for a figure that goes into a report.
How do you make a reported number repeatable?
In short: give every metric one definition in the dictionary and one source, report counts with their denominators, and attach a numbered source note to each figure. Then anyone can recount it and get the same answer.
01 · ONE DEFINITION
Use the entry in your shared data dictionary, including its filter and missing-value rule.
02 · ONE SOURCE
Name the one form or record set each metric comes from.
03 · COUNT OVER DENOMINATOR
Write "15 of 25 respondents", not "60%".
04 · SOURCE NOTE
Number each figure and say where it came from.
Four habits that work with a spreadsheet, a survey tool or an AI assistant.
The denominator does the most work. Take a separate fictional training course: 40 people complete it, 25 answer the follow-up and 15 say they used the skill. "15 of 25 respondents" is accurate. So is "25 of 40 completers answered". "60% used the skill" is not, because 15 completers never answered.
Do not call the people who did not answer non-users. They are unknown. Show the unknown count beside the figure, so the reader sees what the number covers.
If a partner sends only a percentage, ask for the counts behind it before you add it to anything. Averaging percentages from groups of different sizes gives the wrong total even when the labels match.
What should a source note for each figure say?
In short: for each numbered figure, the dictionary entry it follows, the source it was counted from and what it leaves out. Three short lines are enough for a reader to check it.
Put a small number beside each figure in the report, and a table of notes at the end. The worked example below uses the fictional workforce fund, whose partners report placements within 90 days of exit.
Workforce fund example · fictional
The fund's board report says: "100 trainees placed in a job within 90 days of exit [1]." Partner C also reported 55 placements, but counted them within six months [2], so they are held, not added.
| Note | Figure | Definition | Source and what it leaves out |
|---|---|---|---|
| [1] | 100 placed | Placed in a job: within 90 days of exit | Placement surveys from A (42), B (31) and D (27). Excludes Partner C. |
| [2] | 55 held | Partner C: within six months, not the agreed 90 days | C's report. Held until C confirms its 90-day count. |
| [3] | 80 enrolled at C | Total clients enrolled: unique trainees, not sessions | C's enrollment records. Matches the agreement. |
42 + 31 + 27 = 100. Adding C's 55 would give a total that mixes two definitions, and no reader could tell.
The same notes serve both roads. The funder uses them to roll up portfolio results without mixing definitions. Partner C uses them to show exactly which question it still owes the funder, as in checking each report against the agreement.
How do you check an AI-drafted report line by line?
In short: go through the draft one figure at a time and open the record behind it. If you cannot open a record, the figure does not go in the report yet.
An AI tool writes fluent paragraphs, and fluency makes a wrong number look right. Read the draft as a list of claims, not as prose. For each one, ask four questions.
| Check | What you do |
|---|---|
| Record | Open the records the figure was counted from |
| Definition | Confirm it follows the dictionary entry, not a near match |
| Denominator | Confirm who is counted and who is unknown |
| Gaps | Look for numbers the draft should have and does not |
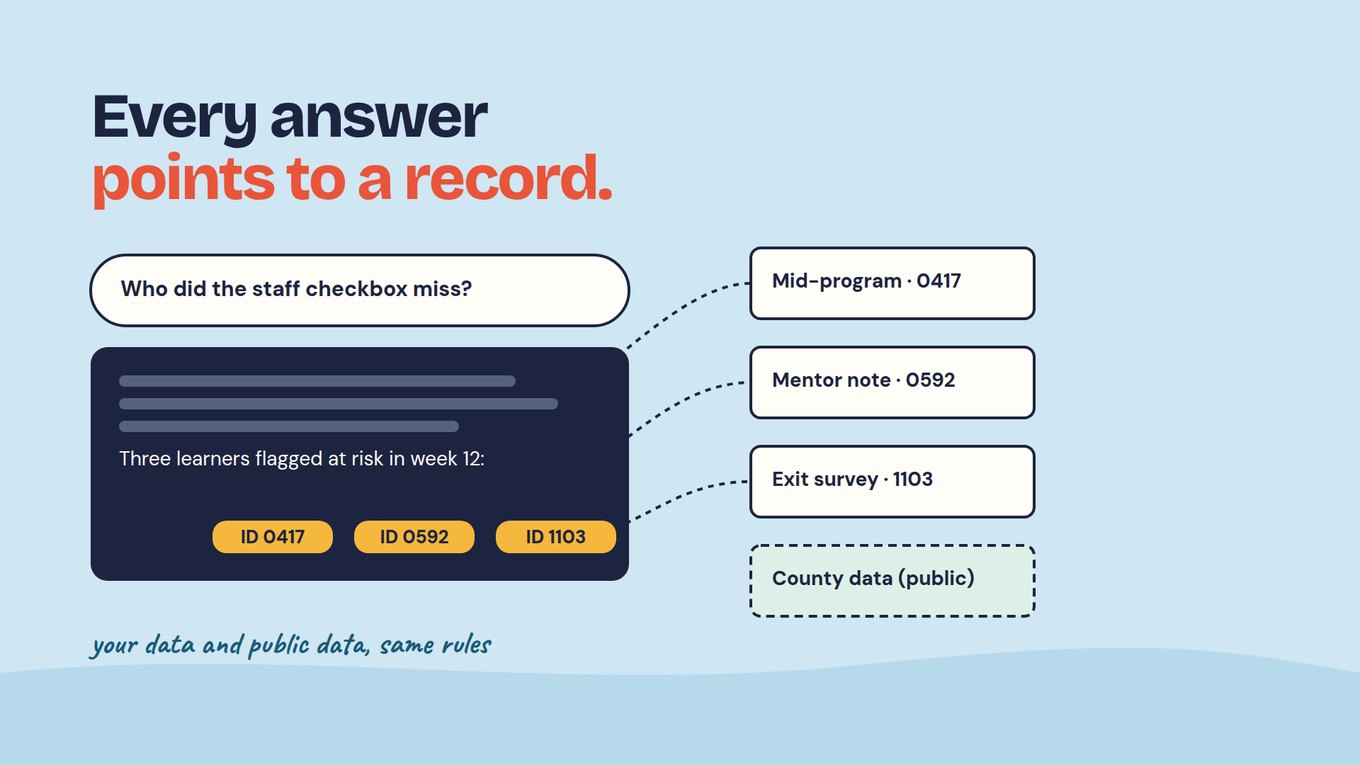
An answer should point to the records it came from, as in the Foundations course example below. A claim about three learners names the three learners, and each ID opens a survey response, a mentor note or public county data.
The gaps check matters as much as the others. In a demo with a workforce program's data, the AI's first draft found total enrolled and female trainees but flagged training hours, job placements and starting wage by track as missing, because the placements survey was not selected as a source. Once it was added, the draft came back complete. A missing number should be flagged, never guessed. The full drafting routine is in write each funder's report with AI, then check it.
What can software do, and what stays a team practice?
In short: software can keep one ID per person and make every answer trace to records you can open. Agreeing definitions, approving changes and keeping a change log stay with your team.
In Sopact Sense today, each person keeps one unique ID from the first form, so enrollment and placement land on the same record. The AI Assistant stays locked until you choose which surveys it may use, and each line of an answer links to a record you can open. Public data loaded as an ordinary survey follows the same rules, which helps when you compare with outside data. See what the assistant may see for how scope is set.
Your team keeps a short change log beside the dictionary: the date, what changed, who approved it and which reported figures it affects. When a late record changes a count, keep the earlier report as sent, and publish the new figure with one line saying why it moved.
ASK ANY TOOL, INCLUDING OURS
Paste a draft report and your dictionary into any AI tool and ask: "List every figure in this draft. For each, name the dictionary entry it follows, the source and denominator, and mark any figure you cannot trace to a record." In Sopact Sense, ask the AI Assistant the same question and open each linked record before the figure goes out.
What tracing cannot do.
A traced number can still rest on a poor definition, and a repeatable count can be repeatably wrong. Tracing shows where a figure came from; it does not show the program caused the change. Making a source checkable also does not mean making it public: a board may see the method and counts, while only authorized staff open the records.
Try it on your own reporting
- Pick the three figures in your latest report that readers ask about most.
- For each, write the count over its denominator, and the unknown count.
- Write a numbered source note: dictionary entry, source, what it leaves out.
- Ask a colleague to recount one figure from your note alone. Where they get stuck is what to fix.
Check your reasoning
In the fictional fund, the portfolio manager first wrote "155 trainees placed". The source note exposed the problem: 100 came from A, B and D under the 90-day definition, and 55 came from C under six months. The board report now says 100 placed within 90 days, from A, B and D, with a note that C's 55 are held until C confirms its 90-day count. The total is smaller, and every reader can check it.
Questions teams ask
Why do two people get different numbers from the same data?
Usually because they used different exports, filters or definitions without knowing it. One kept incomplete rows, another dropped them; one counted sessions, another unique people. Write the filter and definition into the dictionary entry, name one source for the metric, and ask both people to recount from that. If they still differ, the difference is in the records themselves, and you can find it.
Is it a problem when a number changes between reports?
Not if you can explain it. Late follow-up answers, merged duplicate records or a corrected definition can all move a count. Keep the earlier report as sent, give the new figure, and add one line saying which records changed it. What erodes trust is a number that moves with no explanation, or an old figure quietly replaced.
Should we report percentages or counts?
Report the count with its denominator first, such as "15 of 25 respondents", and add the percentage if it helps the reader. A percentage alone hides who was counted and how many are unknown. When you add results across partners, always add counts. Averaging percentages from groups of different sizes gives the wrong combined figure.
Can we trust numbers in a report an AI tool wrote?
Only after you check them. Treat each figure as a claim and open the records behind it. Confirm it follows the dictionary definition, has the right denominator and is not missing anything the report should include. A tool that shows the records behind each answer makes this faster, but the check is still yours.
Does every figure need a source note?
Every figure a reader might act on does. Headline results, anything added across partners and anything that changed since the last report should carry a note. Background figures such as the number of sites can share one note. Keep notes short: definition, source and what the figure leaves out.