Get inspired by what
you can do with Sense
Browse practical Sopact Sense demos across strategy, collecting, analyzing, and communicating impact — one new walkthrough every week.
How to Onboard a Portfolio, Lock In an Impact Agreement, and Track Results Consistently
Run one repeatable loop from grant approval to the LP report: book the onboarding call, lock the impact agreement, and let Sopact Sense chase missing data and flag variance automatically.
How to score a grant proposal with a rubric
Score a proposal against a weighted rubric — and catch the high marks that rest on no evidence.
How grantmakers screen applications for eligibility
Screen applications against your rules in seconds — each field cited per pass/fail, gaps flagged not rejected.
How to analyze a batch of grant applications
Theme a whole grant round before you score it — cluster by theme, population and geography with counts and quotes.
How funders monitor grantee progress against targets
Read a grantee report for variance, not vibes — targets vs actuals, classified on-track, at-risk, or off-track.
How to review a nonprofit's 990 before granting
Pull compliance signals from a 990 fast — expenses, fund use, and auditor concerns, every figure quoted.
How foundations aggregate outcomes across grantees
Roll a whole portfolio up to your theory of change — contribution per outcome and the coverage gaps.
 Strategy · Theory of Change
How to build a theory of change with AI, in minutes
Describe your program and Sense draws the causal chain inline, grading every link by the evidence behind it.
 Strategy · Theory of Change
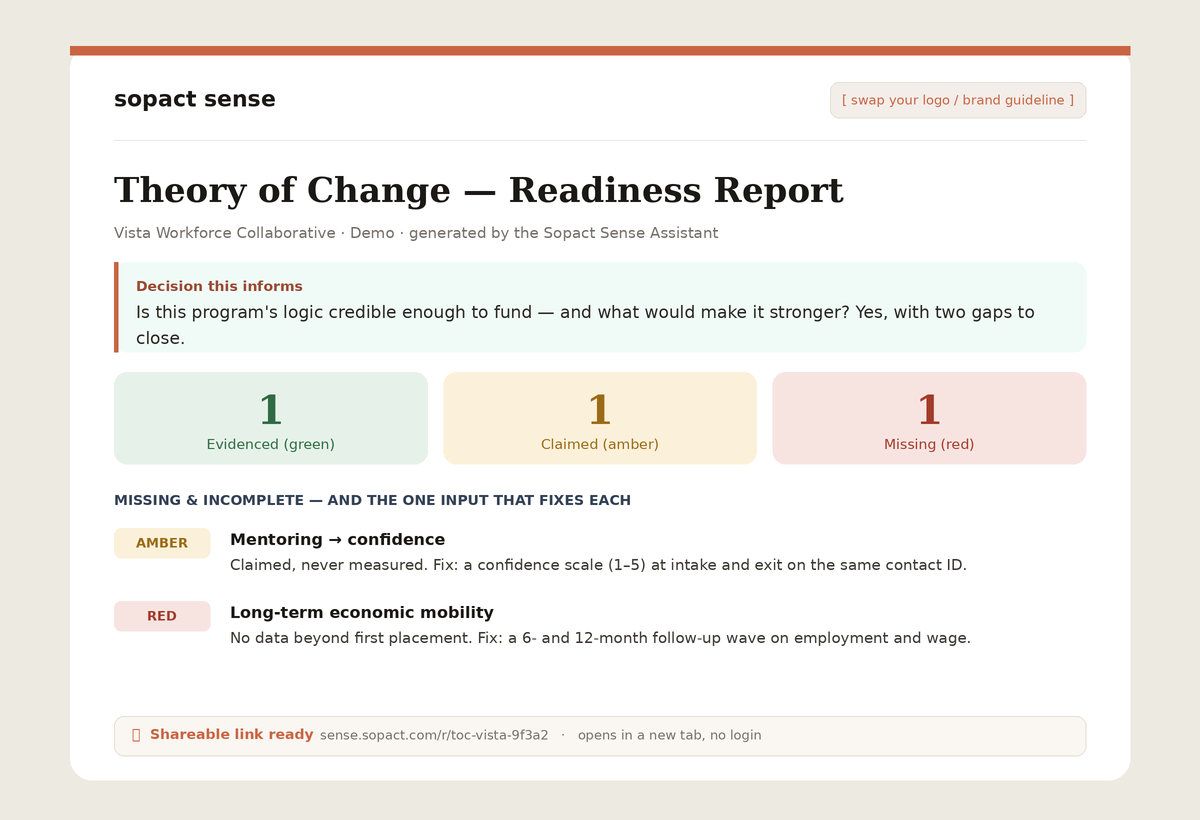
How to audit a theory of change with AI
Point Sense at a program page and it flags every link that rests on a belief instead of data.
 Strategy · Logic Model
Build a logic model and catch the gaps funders spot
Turn a program description into a clean inputs-to-impact model — and see the gaps a reviewer circles first.
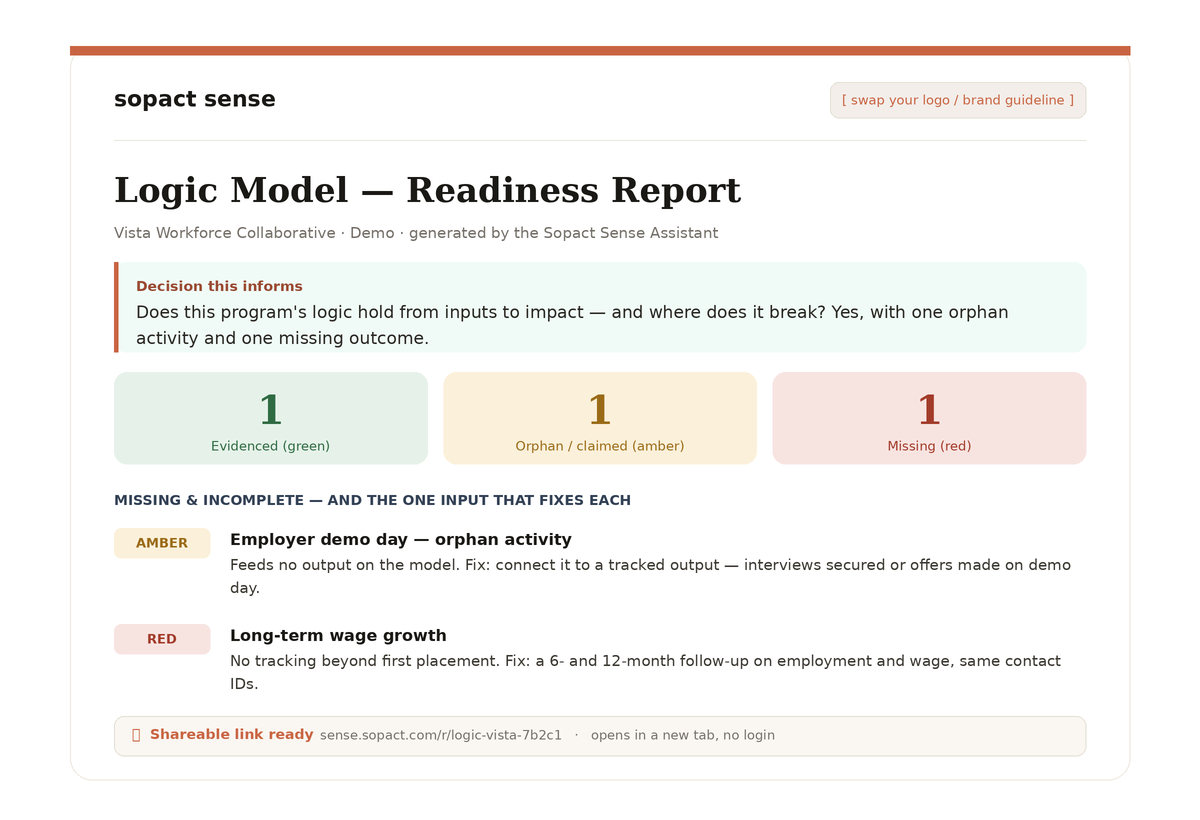
How to audit a logic model with AI
Sense rebuilds the logic model and flags the orphan activities and missing outcomes a reviewer circles first.
Build a logframe (4×4) that passes funder review
Sense fills the matrix — narrative, indicators, verification, assumptions — and flags non-SMART indicators.
Review a logframe and spot unmeasurable indicators
Sense rebuilds the 4×4 from a program page and flags the unmeasurable indicators that get proposals sent back.
Build a results framework, objective to sub-IRs
Sense maps the strategic objective down to intermediate results — and flags the results that don't ladder up.
Audit a results framework, where most go wrong
Sense reconstructs the SO-to-sub-IR hierarchy and flags the unlinked results and missing baselines.
Build an SROI value map, step by step
Sense drafts the value map outcome by outcome, with a sourced proxy and the conservative adjustments.
Estimate deadweight and attribution in SROI
Get each adjustment as a percentage with its basis and confidence — the numbers everyone fudges, evidenced.
Pick a financial proxy for SROI (without making it up)
Sense proposes proxy options per outcome — each with a named source, rationale, and conservatism note.
Calculate the SROI ratio with NPV and sensitivity
Sense discounts to present value, divides by inputs, and runs a sensitivity check — a range, not a single number.
Calculate a blended SROI across a portfolio
Blend SROI across investees weighted by inputs — so the headline shows which investments create the value.
Estimate portfolio impact when the data is thin
Sense keeps measured value separate from benchmarked, marks confidence per line, and names what to collect next.
Extract outcomes from a messy grantee report
Pull inputs, outputs and outcomes from a report, and mark every silent field MISSING instead of guessing.
Classify investments on the IMP Five Dimensions
Score each investee on What, Who, How Much, Contribution and Risk, rate the evidence, and flag a thin 'Who'.
Track one person's change across years, not just averages
Trace each participant on a persistent ID, surface trajectories the cohort average hides, and flag missing waves.
Survey attrition: who dropped off and why it matters
Find who is missing waves and when, compare responders against non-responders, and flag small-n.
Compare two cohorts without fooling yourself
Benchmark cohorts on the same metrics, normalise for size and length, and name every confound.
Do your outcomes last? Measure drop-off and duration
Estimate persistence from post-program measures so a sustained-impact claim never outruns the data.
Write an impact narrative for a funder report
Pair every figure with a verbatim quote — the prompt grades each claim so nothing unsupported ships.
How to analyze pre and post survey data
Join every wave on the stakeholder ID, report % sustained, and flag anyone missing a wave.
Connect quantitative and qualitative survey data
Join quant and qual on the stakeholder ID to explain the number, not just report it.
How to analyze open-ended survey responses
Theme open-text, count each theme, hold single mentions, and reconcile every count back to N.
How to analyze sentiment in survey responses
Classify each response and extract the reason behind it — not just how people feel, but why.
How to clean open-ended survey responses
Trim, standardise and bucket responses while preserving every original — with an audit trail.
Analyze survey results by demographic subgroup
Averages hide who's left behind — disaggregate an outcome by subgroup and grade each cut.
Identify safeguarding concerns in case notes
Scan case notes for harm, crisis and disclosure, quote the evidence, and route every flag to a human.
Document mentoring sessions without inventing emotion
Extract topics, progress, blockers and actions with evidence — and never infer emotion.
Identify the barriers your clients keep hitting
Surface the barriers a whole caseload keeps hitting — counted, quoted, and classified system vs individual.
Measure a mentee's growth across every session
Trace a mentee's trajectory in date order, with momentum and the aging blockers that signal risk.
Measure youth development against a framework
Map a young person's progress to a development framework — rated, evidenced, and growth-tracked.
How to assess learning from student reflections
Read a reflection for real learning depth — surface, applied, or transfer — and grade it in one pass.
How to standardize case management notes
Extract needs, progress, risks and next steps from free-text notes into structured, actionable data.
How to evaluate mentoring relationship quality
Assess fit and risk for a pair from the notes — and decide continue, re-match, or human review.
How to track caseload progress over time
Track momentum across a caseload and surface the clients who quietly stopped moving — early.
How to analyze LMS engagement data
Relate engagement signals to outcomes, name who's at risk, and keep correlation honest.
How to assess holistic client wellbeing
Synthesise a whole-person status across every life domain — at-risk, stabilising, or thriving, with evidence.
How to apply the Kirkpatrick model to a survey
Map every question to Kirkpatrick's four levels, flag what you don't cover, and fill the gaps.
.png) Data Dictionary & Skills · Data Governance
Data Dictionary & Skills · Data GovernanceHow to Build One Data Dictionary That Holds Across Every Hospital, Program, and Year
Define every field once so it means the same thing across every hospital, program, and year.
