


Connected Data Intelligence is Sopact’s term for keeping authorized survey responses, comments, files, notes and other records connected to the people, organizations or events they describe across time. This reference provides eight checks: team control, record identity, coverage, comparable cycles, qualitative analysis, document context, appropriate AI access and reproducible reporting. The phrase describes this working approach; it is not a certification or a universal technical standard.
Key takeaways
- The unit of value is one continuing record, across the cycles you need to compare. Test how records join and how errors are corrected.
- Evaluate the complete workflow: collection, identity, files, analysis, access and reporting. A feature list alone does not show who will operate it.
- Eight checks help you test it. Run one complete cycle — not a demo of one form — and see which check breaks first.
- Estimate the cost of the planned population, collection cycles, documents and review work. Choose a census or sample for the decision, with its limitations visible.
- Connected Data Intelligence organizes and governs the evidence. Impact Measurement & Reporting decides what it means.
What are the eight checks?
These are eight practical checks on one complete collection cycle. Use them to identify work that still depends on manual joins, unclear definitions, inaccessible files or undocumented review. They are acceptance tests for your workflow, not a claim that every survey product fails them.
- Self-driven
Your team controls the questions, the rules, and the changes.
- One record
Every response stays with the correct person or organization.
- Volume
Planned coverage, participation and missing groups are visible.
- Longitudinal
Cycles remain comparable as the instrument evolves.
- Qualitative
Comments explain the numbers, safely and at scale.
- Documents
Uploaded files retain source context and stay queryable.
- Assistant
AI respects consent and anonymity, and leaves judgment to people.
- Reliable
A reviewer can reproduce any number in the report.
Use the checks as a review list within the five course modules. Several apply throughout the workflow; they are not a second learning sequence.
Use these checks inside your chosen workflow
Use this shared reference within your chosen course. Keep following the membership, case, training, applications, portfolio, supplier, customer or employee workflow you selected. Use the relevant check when you need to test whether its evidence stays usable.
| Course module | Checks that help you test it |
|---|---|
| Collect flexibly | Team control, correct identity, planned coverage and document context |
| Analyze on arrival | Reviewed qualitative interpretation, sources and appropriate assistant access |
| Connect over time | Dated records, comparable cycles and visible corrections |
| Set shared definitions | Compatible measures, approved mappings and reproducible calculations |
| Own and govern | Permissions, review ownership, version history and reporting approval |
A check can apply in more than one module. You do not need to learn a second sequence. Test one complete example through the five modules, including an incomplete record and a correction.
What should the team demonstrate?
| Bring | Test | Record the effort |
|---|---|---|
| Two waves and a duplicate | Correct matching, reversible correction and history | Setup, exception review and ongoing ownership |
| A partner form, document and transcript | Entity, period and traceable source passages | Supported formats and reviewer time |
| A changed local question | Compatible shared mapping or an explicit series break | Who approves the change and checks past reports |
| A restricted record | Permitted retrieval and safe output | Configuration and access review |
What the eight checks mean, and how to test each one
Run these against one complete cycle of your own work—a cohort, member survey or review round. A single-form demo cannot establish whether identity, revisions, documents and reporting remain connected across time. Record what succeeds, what needs configuration and what still requires a manual step.
01 · Self-driven
Test which routine changes the authorized team can make, including questions, collection waves and reporting rules. Access changes and consequential definition changes should still follow the agreed approval process.
Use: One real cycle, and one question you decide to change halfway through.
Pass: The change is made by your team, is logged, and does not orphan the responses already collected.
02 · One record
Decide which authorized records should be linked and how the match is established. A persistent identifier supports continuity, but duplicate or incorrect identities still need review. Recontact permission and permission to use existing records are separate questions; define and test the applicable rules.
Use: One participant who responds three times across two cycles, plus one respondent who declines consent to be re-contacted.
Pass: The intended responses join under the configured rule; a duplicate is flagged or corrected. Recontact restrictions are respected without assuming they automatically require deletion or unlinking of all historical records.
03 · Volume
Choose coverage for the decision. Individual service follow-up may require reaching every eligible person, while a research question may be answered with a well-designed sample. An attempted census can still have nonresponse bias. AAPOR’s survey guidance explains why sampling, mode and question design matter. Record who was eligible, invited and represented, rather than judging quality from response count alone.
Use: Your defined population and planned census or sampling approach, including likely nonresponders.
Pass: Coverage, response rate, non-responders, and missing groups are visible as numbers you can act on.
04 · Longitudinal
Cycles have to stay comparable even though the instrument changes. A new question should extend the series, not restart it, and any change to a repeated question should be visible in the output.
Use: Two cycles where one repeated question was reworded and two new questions were added.
Pass: The revision is disclosed and its comparability assessed. If the meaning or method changed, the report marks the break rather than treating the series as automatically comparable.
05 · Qualitative
Open comments provide respondents’ explanations and additional context for a score. They should be themed as they arrive, in the languages people actually answered in, with the original wording preserved and citable.
Use: Supportive, critical, and contradictory comments — in more than one language, with at least one small subgroup.
Pass: Theme labels trace to original passages; a reviewer checks contradictory examples and translations. Outputs follow the approved disclosure rules, including small-group and free-text identification risks.
06 · Documents
An uploaded strategic plan, lab result, transcript, or grantee report is evidence. It should be readable in place and attached to the same record as the survey answers, not filed somewhere a dashboard cannot reach.
Use: Several authorized files of different types, attached to different records.
Pass: A finding drawn from a document cites the document and the passage, and the file stays on the record.
07 · Assistant
An assistant can support coding, drafting and questions about authorized evidence. Test the actual retrieval and output controls, not just a written instruction asking it to behave safely. Human reviewers remain responsible for sensitive interpretations and decisions.
Use: A subgroup small enough to re-identify, and one ambiguous comment.
Pass: Restricted evidence is unavailable to unauthorized users, ambiguous interpretations are flagged for review, and the output follows the approved disclosure rules. Test attempts to retrieve identifying text as well as the final chart.
08 · Reliable
A reviewer who did not build the report should be able to reproduce a headline number and a theme from the underlying evidence.
Use: One finished report and one reviewer who was not involved in producing it.
Pass: Definitions, filters, population, calculation, theme configuration, and source records are all inspectable.
The record is only half the problem
The checks address record continuity and review, but a linked record does not settle what a number means. Two teams can identify the same people and still produce different totals because “enrolled” was never defined. Agree the population, period and calculation as well as the identity rules.
Two questions help separate record problems from measurement problems:
The record axis
"Is this the same person, and did their answer survive?"
Identity, continuity, coverage, source, consent, reproducible retrieval. When this fails you cannot tell whether anything changed for anyone.
Review identity, sources, coverage and access within the chosen workflow.
The measure axis
"What does this number actually count?"
Population, unit, period, boundary, calculation, disaggregation. When this fails everybody agrees on the participants and still produces different totals.
Governed by the data dictionary.
Checks 04 and 08 depend on both axes, which is worth being explicit about because it is where teams get caught. A cycle-over-cycle comparison is only meaningful if the measure definition held steady as well as the record — otherwise you are comparing two different questions asked of the same people. And a report is only reproducible if the calculation is written down somewhere a reviewer can read, not carried in the head of whoever built it.
Definition work belongs in the shared-definitions module of your chosen course. Start with giving every number one definition to settle what a single measure means, then build the governed data dictionary that holds those definitions as fields with owners, allowed values, and versions. If you also report against external frameworks, mapping one dictionary to IRIS+, GRI, and ESRS covers how to do it by comparing definitions rather than labels.
One terminology note, because the two axes use similar-sounding words for different things. A persistent ID identifies a person across waves — that is check 02. A stable field ID identifies a column across dictionary versions. Both matter and neither substitutes for the other.
Different local questions can still support a shared result
A network does not need one survey for every member. Agree the limited core measures needed for a specific comparison, reuse stable registration fields and retain dated changes to profiles. Let local teams collect useful additional evidence in their own instruments.
The dictionary records how compatible local fields map to the shared measure, including the unit, population, period and calculation. If the meanings differ, retain separate results or collect the missing evidence. A mapping cannot turn attendance entries into distinct people without the information needed to distinguish them.
Which shape is your data?
The eight checks tell you what to test. Which of them will actually hurt depends on what your record follows — a person you contact again, several people describing one person, many programs you want one picture of, or a network where each member needs their own part. There are four common shapes and they make different checks difficult.
That is a decision worth making before anyone builds a form, and it has its own page: which shape is your data? — with the four shapes side by side, how to tell which one you are, what to do if you are more than one, and practical examples for each.
Which check fails first tells you what to fix
The eight checks can guide diagnosis. A symptom may have several causes, so use the suggested check as a starting point rather than a conclusion. Ask what evidence would confirm the problem before selecting a fix.
| What the team says | Checks to investigate first |
|---|---|
| "Every cycle we start over." | 02 and 04 — there is no continuing record for a new response to join. |
| "We can't get a good response rate." | 03 — investigate contact coverage, burden, accessibility, timing and nonresponse; cost may be one factor. |
| "We collect open-ended feedback but never analyse it." | 05 — the comments arrive faster than anyone can read them. |
| "Our reports take a quarter to produce." | 01 and 08 — inspect ownership, repeated reconciliation and undocumented calculations. |
| "The board asked where a number came from and we couldn't say." | 08 — the calculation lives in a spreadsheet nobody can re-run. |
| "Legal won't let us use AI on this." | 07 — clarify permitted uses, access, disclosure and the review process with the responsible team. |
Where the checks are hard to pass without a system
All eight are achievable by hand. A careful team with a source map, a real identifier, and a disciplined analyst can pass every one of them for one cohort. The difficulty is repetition: the same eight checks have to hold for the next cohort, the next language, the next reporting period, and the next person who inherits the work.
The pattern is well documented in the sector, if dated. Innovation Network's State of Evaluation 2016, a survey of 1,125 US nonprofits, found that 6% reported internal evaluation staff in the staffing analysis, 27% worked with an external evaluator — rising to 49% among organizations above $5M — and 55% used four or more separate methods to store their data, which the report identifies as a direct obstacle to analysis. Limited staff time, money, and expertise were the top three barriers for the third consecutive edition (State of Evaluation 2016). These are historical findings, not current prevalence estimates or proof that every sector faces the same conditions.
The hard part happens the moment an answer arrives
The difficult bit is not storing what people tell you. It is sorting each answer out as it comes in — while it is one answer, from one person — so that months later you can look something up instead of reading everything again.
Here is what that means in practice. Someone writes you a paragraph about why they nearly dropped out. Right now that paragraph is just text sitting in a box. It only becomes something you can use once three things are known about it: which of your measures it relates to, what it tells you, and which sentence in it backs that up — all of it filed against the right person.
Preparing evidence as it arrives can reduce later review work. It does not make every future question easy: a new question may require a new coding scheme, another source or a different permission. Retain the original text and analysis version so earlier interpretations can be checked and revised.
The recurring workflow depends on those connections. You can investigate comparisons across years when definitions, collection methods and analysis versions are sufficiently comparable. You can say what people's comments add up to because they were sorted as they landed, not in a pile at the end. And someone can check your figure because there is something underneath it to check.
Where does this fit alongside a CRM or data warehouse?
A CRM, document store, analytics platform or AI assistant may already provide part of the workflow. Some offer document analysis, automation and governed retrieval. The evaluation should establish what is configured and usable in your environment, rather than assume an entire product category cannot do it.
Sopact’s focus is AI-native data collection and analysis across continuing records: responses from contacts, partner updates, internal evidence and uploaded documents. It is particularly relevant when data owners need to manage repeated collection and review across locations or organizations. It is not a proposal to replace every operational system with a data warehouse.
Map the responsibilities before choosing software. Your CRM might remain responsible for contact administration; an approved file store might retain original documents; the collection workflow might manage reporting periods and review status. Define which source is authoritative for each field and how corrections travel between systems.
Ask an AI assistant to show the filtered records and calculation behind a total. Some tools can run deterministic queries; others may generate an estimate from text. The requirement is verifiable computation where a count is claimed—not an assumption that all AI necessarily guesses.
Use the eight checks to locate the gap. It may be a missing identifier, an unsupported document format, a permission problem or a recurring reconciliation task. Select the smallest workable change, then test the whole cycle before expanding.
Include implementation and ownership in the cost
The license is only one part of the cost. Include instrument design, migration, identity cleanup, integrations, reviewer time, training and maintenance. A free form can be suitable for a small task; it becomes expensive when staff repeatedly reconstruct the same history or reconcile incompatible exports.
Advisory support can be valuable when it leaves a process the team understands. Agree which decisions stay with staff, which tasks need specialist help and what documentation is handed over. Ask who will support the next cohort, source change or reporting revision.
Test routine changes with the person who will actually operate the workflow. Can they amend a question, understand the effect on past data, review an exception and produce a source-linked answer? Record the time, training and help required. This is stronger evidence than a promise of instant self-service.
Clear questions and reviewed analysis settings still matter with AI. Staff should not need to become software engineers to manage the process, but an ambiguous request can produce an ambiguous answer. Use shared definitions and reusable review criteria to reduce dependence on individual prompting skills.
What "reliable" looks like from outside
You do not need to know how any of this is implemented to establish whether it holds. The tests are already above, and every one of them is observable from the outside:
- The same calculation on the same approved data version returns the same number. If sources, filters or definitions changed, the difference is explained.
- An authorized reviewer can open the records behind a figure and recompute it. Shared or public outputs must still respect the agreed access and disclosure rules.
- The analysis retains source passages and review history. Test coding on varied examples and inspect errors before relying on results at scale.
- The release follows approved small-group and free-text disclosure rules, including indirect identification risks.
- Your authorized team can make a routine question change and explain its effect on existing evidence.
Judge it on those. People still decide what to collect, review sensitive interpretations, correct identity errors and own the conclusion — the workflow should support those responsibilities with inspectable records, calculations and changes.
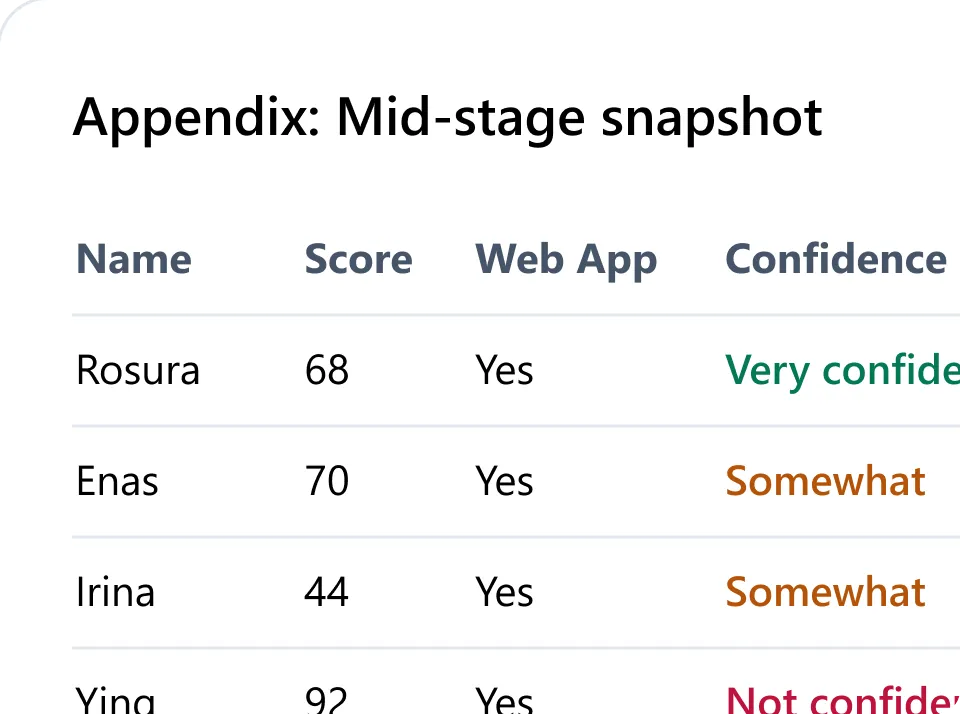
Practice: follow one partner update from collection to review
Use this self-contained fictional example to test the workflow. Partner P-024 submits a quarterly form reporting 40 people completing training. The partner uploads a financial PDF labeled Q2, an attendance file containing 42 rows and a transcript explaining transport difficulties. The current request covers Q3. None of those differences should be silently repaired by an AI summary.
First identify the record. The partner ID, reporting period and submission version are separate fields. Two staff members submitting files for the same partner should not create two partner organizations. Equally, a previous quarter’s attachment should not be relabeled as current evidence just because it arrived today.
Next define the measure. Does completion mean attending every session, meeting an attendance threshold or passing an assessment? Forty completions and 42 attendance rows might be compatible if the file contains visits, duplicates or people who did not complete. Inspect the records and definition before calling it an error.
Then analyze each source for its stated purpose. Extract the PDF’s reporting period and flag the mismatch for review. Identify the transcript passage about transport, preserving the original text and context. Treat the theme as a possible explanation to investigate, not evidence that transport caused every incomplete outcome.
Keep a short exception record: issue, source, question for the partner, owner and resolution. The reviewer may request the correct financial report or explain why the Q2 file was intentionally supplied. Preserve the original submission alongside the correction, and mark which version is approved for the Q3 report.
Finally ask a colleague to answer: “How many people completed in Q3, what definition was used and which evidence supports the number?” The expected response is a checked number or a clear unresolved status. A confident answer without the definition and sources fails the exercise.
Repeat the test with a second quarter. Can the reviewer distinguish a new outcome from a correction to the old submission? Can another authorized staff member continue the work? This is the practical value of connected records: less reconstruction, more visible questions and a clearer basis for action.
You can run the same exercise with a customer check-in, a training participant or a supplier review. Change the entity and measures, but retain identity, period, source, version and review status. Choose the record structure appropriate to your course: one person, an organization, an event or related records.
The one thing to do this week
Take the last report your team produced and run check 08 on it. Hand it to a colleague who did not build it and ask them to reproduce one headline number from the source records. Time how long it takes and note what they had to ask you for. Whatever they could not find on their own — the definition, the population, the filter, the calculation, the responses — is the first check you are failing, and a concrete place to begin.
Frequently asked questions
What is Connected Data Intelligence?
It is the practice of keeping evidence from surveys, comments, files, notes, and other systems attached to the person, organization, or event it describes, so the record continues across cycles. In practice it is verified by eight checks on one complete cycle: self-driven, one record, volume, longitudinal, qualitative, documents, assistant, and reliable.
How is this different from a survey platform?
A survey platform may cover several of these requirements. Test whether your configured workflow links authorized records across cycles, retains document context and supports reproducible analysis. These checks focus on the complete collection-to-review process, not a universal boundary between products.
How should we budget for repeated collection?
Include the planned population, collection cycles, processing and human review when estimating the cost of the collection plan. It does not make a sample inherently invalid or a census automatically representative. Consider the research question, sampling design, nonresponse and the full implementation cost together.
Can these checks be passed without buying software?
Yes. A disciplined team can maintain identifiers, definitions, source files, calculations and access across multiple cycles without buying a new platform. Evaluate the workload, risks and continuity when responsibilities change; repetition can make dedicated tooling worthwhile.
How do you read open comments without breaking anonymity?
Define what anonymity or confidentiality means for the collection first. Names are not the only identifying information: roles, events and quoted text can reveal someone. Use appropriate access, minimization and disclosure review, and do not promise anonymity for a record that remains linked to an identifiable person.
Does an uploaded document count as evidence?
It should. A strategic plan, transcript, or grantee report often carries the explanation the survey question missed. Check 06 asks whether that file can be read in place and cited on the same record — in some tools uploaded files are excluded from exports and dashboards entirely, which means they are storage rather than evidence.
Should I leave my current course to use these checks?
No. Use this reference for the issue you are testing, then return to the module you were working on. The five modules already cover collection, analysis, history, shared definitions and governance.
Return with one tested improvement
Choose the check most relevant to your current module. Test one complete record, write the evidence for what worked and record the unresolved issue, owner and next action. Use the return link on this page to continue your course.