


Course progress and additional readings
Foundations · Lesson 5 of 6
You will make: One outcome measure in eight fields, and the sentence you would report with its coverage, unknowns and limitation.
The board meets next week. Someone will ask whether the spring cohort worked, and the spreadsheet already holds an answer: 60%. Before that number goes on a slide, ask three things. Sixty percent of whom? Measured when? And where are the people who never answered? If the file cannot tell you, the number is not ready to defend.
This lesson turns one question into one outcome measure you can stand behind. It uses the same fictional training team from earlier lessons and the question they have been carrying: which completers used the skill at work after 30 days, and what stopped the others?
01 · SEPARATE
Delivery, outcome and cause are three different claims.
02 · DEFINE
Write the measure in eight fields.
03 · LINK
Put every wave on the same ID.
04 · REPORT
Result, coverage and unknowns together.
05 · EXPLAIN
Use open-ended answers to explain, not to count.
The method at a glance. Each step has its own section below.
What do the usual paths make hard at this step?
In short: They lose the denominator. A follow-up export holds only the people who answered, so the people who did not answer vanish, and the percentage quietly describes a different group.
Follow the most common path. The team exports the 30-day follow-up from the survey tool, opens it in Excel and pastes it into ChatGPT with the question. The export has 25 rows, because 25 people responded. The 40 completers live in the attendance spreadsheet, and registration lives in the CRM. Nothing in the file says that 15 more people were eligible and silent, so the model divides 15 by 25 and writes, confidently, “60% of learners are using the skill.”
Nothing errored. The answer is well written and wrong about who it describes. Paste the file again and the wording may change; the missing 15 will not come back, because they were never in the file. Blank cells get read as “no” or dropped, depending on the day, and names and emails travel into the chat with the answers.
A CRM with AI bolted on has the 40 names but not the follow-up survey, which sits in another tool with no shared ID. A warehouse could join them, if you had an engineer to maintain the pipe. Either way, the denominator lives in one system and the answers in another.
25 rows in the export. The 15 non-respondents are not in the file, so “15 of 25” becomes “60% of learners”. Every quarter starts with a new export.
The follow-up goes to the 40 IDs created at intake. A missing answer is a visible gap on a known person, and the result is reported against all 40.
What is the difference between delivery, outcome and cause?
In short: Delivery is what you did. An outcome is what changed for people. Cause is evidence that you made it change, and it needs the most support.
The same split applies elsewhere. A closed ticket is delivery; a customer saying the issue is resolved is an outcome. An award is delivery; what the grantee achieves with it is an outcome.
How do you write one outcome measure?
In short: Fill in eight fields. If two people would compute a different number from your definition, it is not finished.
OUTCOME MEASURE · TRAINING EXAMPLE (ILLUSTRATIVE)
The denominator field carries two numbers on purpose. “25 who responded” is the base for the rate; “40 eligible” is the base for coverage. Drop either one and the reader can no longer tell what the result describes. Record who approved the definition and when; a short change log kept by the owner is enough.
Why do waves only compare when they sit on the same ID?
In short: Change is a difference within the same person. If intake, exit and follow-up are separate files matched by name or email, you are comparing groups that may not contain the same people.
Maria, ID 0417, rated her confidence 2 out of 5 at intake and 4 out of 5 at exit. That comparison means something only because both answers belong to her. Match by name instead and a changed email, a nickname or a second Maria breaks the link without warning. The same holds for the whole cohort: the 40 in the denominator exist as a fixed group only because each person got an ID at intake that every later form carries.
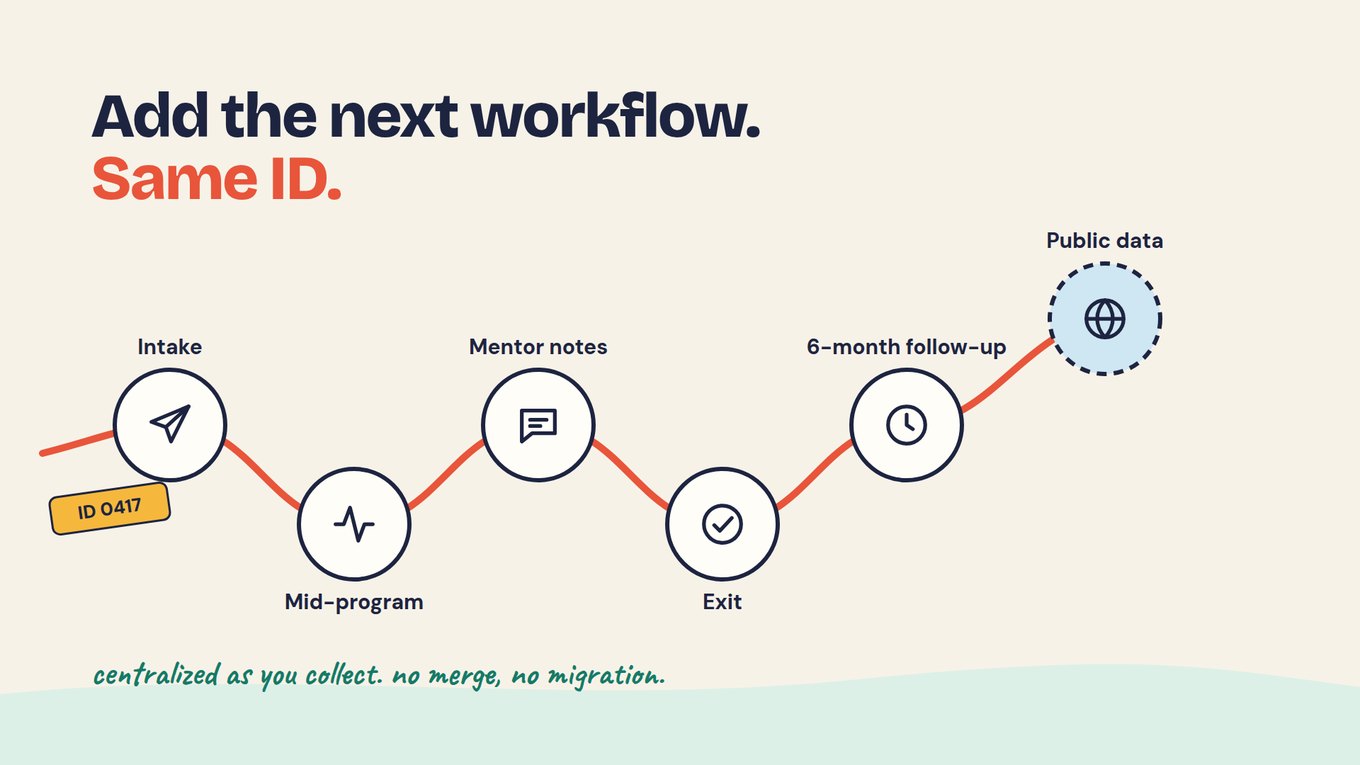
Start with one form, give every person an ID there, and add each later workflow to that same ID: mid-program check-in, mentor notes, exit survey, the 30-day and 6-month follow-ups, and public data loaded as its own survey. Nothing has to be merged at the end, because nothing was split. When you want to follow people past the 30-day mark, following people over time shows how to keep intake, exit, 30 days and 6 months comparable.
How do you report the number honestly?
In short: Always show three numbers together: the result, the response coverage and the unknowns. Keep “no reply” as its own value, never as “no”.
| All 40 completers at 30 days | People | Share of 40 |
|---|---|---|
| Used the skill | 15 | 37.5% |
| Did not use it | 10 | 25% |
| Unknown (no response) | 15 | 37.5% |
Training example, fictional. 25 of 40 responded (62.5%); 15 of those 25 used the skill (60% of respondents).
“60% of learners use the skill.” It treats the 15 who did not answer as if they had, and implies lasting use from one checkpoint.
“15 of 25 respondents (60%) used the skill within 30 days. 25 of 40 completers responded (62.5%); outcomes are unknown for 15.”
The unknown 15 set the honest range. If none of them used the skill, 15 of 40 did; if all of them did, 30 of 40 did. The truth sits somewhere between 37.5% and 75%, and you do not know where. Who the 15 are matters more than how many: if they skew toward people who missed sessions, the 60% flatters the cohort. Who stops responding shows how to check that and how to follow up without pressuring anyone.
Do you need a baseline?
In short: Only if you want to claim improvement. Measure the same thing at intake and later for the same people, linked by ID, and compare only people with both waves.
Maria’s move from 2 to 4 is change for one person. For the cohort, use the matched-pairs rule: include only people with both an intake and an exit answer on the same question, say how many that is, and report the spread of changes beside any average. Do not call it “twice as confident”; a 1–5 scale has no true zero. Pre, mid and post works through a full matched comparison, including what to do when someone misses the middle wave.
To claim the program caused the change, you need more: a comparison group, such as people on the waitlist, or strong supporting evidence. For Maria, that evidence is on her record. She attended 10 of 12 sessions, her mentor saw her lead a mock interview, and at 30 days she reported using the skill on the job. That supports a careful sentence about one person, not a causal claim for the cohort.
How should you use open-ended answers?
In short: Use them to explain the numbers and to find what to test next, not to estimate how common something is.
The second half of the team’s question, what stopped the others, lives in words, not in question 7. If 5 of the 8 non-users who described a barrier mention no time to practise, that is a strong lead for your next review. It does not tell you what share of all 40 completers faced the same problem. Keep the original words, put your theme in a separate field, and let the lead become a test: the team’s next step is to try a practice session with the next cohort and see whether use at 30 days moves.
A limit worth stating once: this measure is self-reported, more than a third of it is missing (15 of 40), and one checkpoint shows use at day 30, not lasting use. Written next to the result, those limits are what make it a number a board, funder or auditor can trust.
How does Sopact Sense handle this?
In short: Every wave is added to the ID created at the first form, so the denominator never leaves the record. Results are read as responses arrive, and the people who have not answered stay visible beside the result.
In Sopact Sense the 30-day follow-up is another workflow on the same record, not a separate export. The Intelligence Cell reads each open-ended answer as it arrives with a prompt your team configures. The AI Assistant answers plain-language questions such as “how many of the 40 completers have answered, and how many used the skill?” and every line links to a record you can open. You choose which fields are sent to the AI, so names and emails can stay out, and the Assistant stays locked until you pick which surveys it may use.
A shared place for definitions, where your eight-field measure would live for the Assistant to use, is coming soon. Until then, keep the definition in your evidence plan, and check the first calculation by hand.
ASK ANY TOOL, INCLUDING OURS
In a demo on your own data, ask: “Of everyone who completed, how many answered the follow-up, and who did not?” A good answer gives the eligible count, the respondents and the non-respondents as separate numbers, and lets you open each record. Then ask: “Show confidence at intake and exit for people with both answers.” A good answer states how many matched pairs it used and never fills a missing wave with a guess.
Add this to your plan
Open your working evidence plan ↗
- Write one outcome measure for your workflow using the eight fields above, including both the respondent base and the eligible base.
- Name the ID that links the waves you need. If there is none, write which form should create it.
- Write the sentence you would report, with coverage and unknowns, and the range the unknowns allow.
- Write one limitation and who approved the definition.
Check your reasoning
A strong measure keeps the 40 eligible, the 25 respondents and the 30-day window together, treats non-response as unknown and says the result could sit anywhere from 15 to 30 of 40. It names intake as the form that creates the ID every later wave uses. It makes no causal claim without a baseline or comparison. If a colleague would calculate a different number from your definition, tighten it.
Questions teams ask
What is the difference between an output and an outcome?
An output, or delivery, is what your team did, such as sessions run or people trained. An outcome is a change observed in people or organizations afterwards, such as using a new skill or resolving an issue. Report both, and never relabel an output as an outcome.
What response rate is good enough?
There is no single threshold. Report coverage every time and check who is missing. If the people who did not respond differ from those who did, for example by site or attendance, the result may not represent everyone.
Do we need a control group?
Not to report an outcome. You need a baseline on the same people to claim improvement, and a comparison group or strong supporting evidence to claim the program caused it. Say clearly which of these your evidence supports. “Used the skill”, “improved” and “because of the program” are three different claims.
How should we handle missing answers?
Record them as “no reply” or “unknown”, never as “no”. Report how many there are next to the result, and show the range they allow. If the decision depends on it, follow up with non-respondents through a channel they agreed to.
Can AI calculate the measure for us?
Yes, if the definition is written down and every wave sits on the same ID, so the eligible group is in the data rather than in someone’s head. Check the first calculation by hand against your definition.
Deep dives for this lesson
Open one when the lesson raises that question, then come back. Each uses the same training-team example.
- How to Analyze Pre, Mid and Post Survey DataMatch the same people by ID across waves and report change only for complete pairs.
- How to Analyze Longitudinal Survey DataFollow people from intake to 6 months on one ID and keep every wave comparable.
- Survey Attrition in Longitudinal Studies: Track Missing WavesTrack who stops responding, keep unknown separate from no and report coverage.