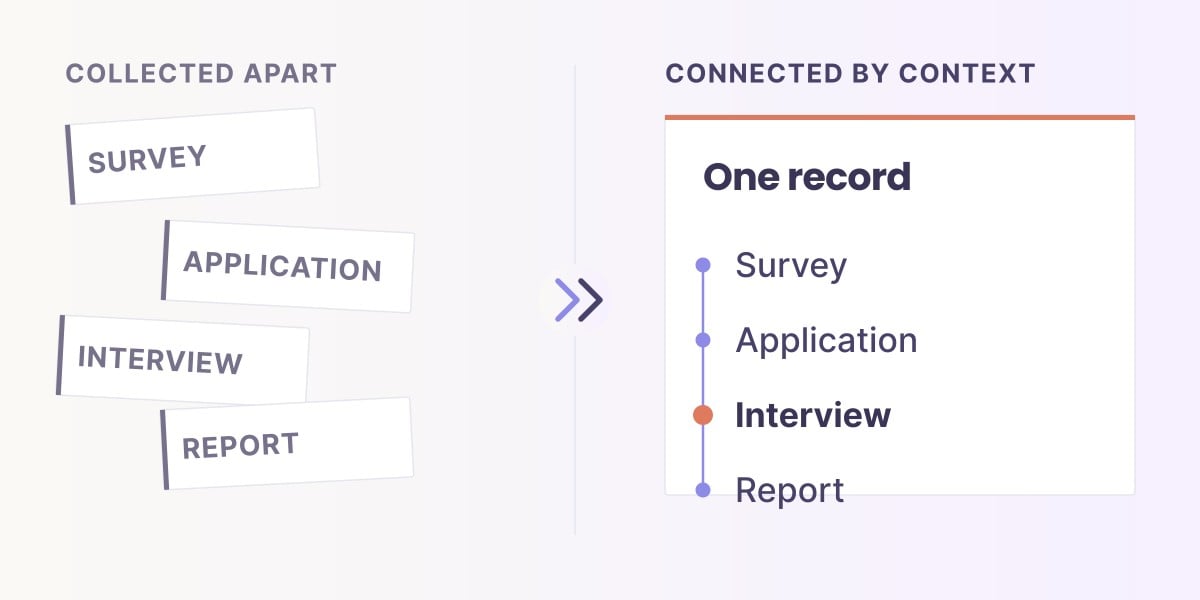
What is impact storytelling?
Impact storytelling is telling one person's or one group's experience of change in a way a reader can check: a real voice, used with permission, placed beside the measured change it helps explain. It shows what a result was like from the inside, without pretending to be the result.
A story can follow a participant, a site or a decision that changed how the work was done. It does not need a dramatic ending. What makes it an impact story rather than a testimonial is that every fact in it leads back to a record.
THE SHORT VERSION
- Pair one voice, used with permission for this audience, with change per person, and label which is which.
- Tell it in the funder's words and your own voice, and keep a written list of the claims you will not make.
- Trace every fact in the story to a record you can open; if you cannot, cut the fact or find the record.
What makes an impact story credible to a funder?
A story is credible when the reader can see three things apart: what this person said, what the wider group showed, and what anyone can say about cause. Mixing them is the most common way a good story loses trust.
- One person's accountWhat they said or what their records show
- Change per person, across the groupWhat the agreed metrics show for everyone counted
- Explanation of changeWhat a comparison can support about cause
- Published storyEach claim labelled, each source available for review
A quote explains a number; it never replaces one.
The number shows how common a change was; the voice shows what it was like. A quote alone invites "how many?", and a table alone invites "so what?".
The video below explains why accurate numbers still get ignored when readers get no context. Watch for where one well-chosen account would help.
How do you write an impact story? Seven steps
Start from the reader's question and the contributor's own account, check each fact against its record, then write, review and end with what you learned.
- Choose the question and audience. Decide what this reader needs to understand: a barrier, an experience, a change or a lesson.
- Start with the contributor's perspective. Ask what mattered to them and how they describe it. Do not begin with a conclusion their account must confirm.
- Establish the sequence. Set out the starting point, what happened and what followed, with dates. Separate what was recorded at the time from what is recalled later.
- Check each fact against its record. Separate direct observation, self-report and interpretation, and resolve or explain contradictions.
- Write a focused narrative. Use concrete detail and the contributor's own words. Keep your organization in proportion.
- Review accuracy and permission. Check quotes, identifying details, images, translation and audience, and give the contributor a chance to see how they are represented.
- End with the lesson and next step. Say what the story helps readers understand, what remains unknown and what the team will do next.
What should an impact story template include?
Five parts, each answering one reader question: context, experience, change, the wider picture and what you learned. Treat it as a checklist of questions, not a script that turns every experience into a success story.
| Part | What the reader needs | What to check |
|---|---|---|
| Context | The person, place, goal and starting point | Accuracy, and whether it can be shared |
| Experience | What happened and what mattered to them | Original words and dates |
| Change | What was observed afterward, setbacks included | The record, its window and other explanations |
| Wider picture | How this relates to the agreed metrics | Who is counted, who is unknown |
| Learning | What the team now does differently | Whether it is proposed, under way or done |
Place the key evidence next to the claim it supports, not in an appendix. The impact report template shows where a story sits inside the wider report.
What does a credible impact story look like? An example traced to its records
A credible story names only facts that open to a record, uses a quote the participant permitted for this reader, and says plainly what is not known yet. This example is fictional: Partner C, the workforce training program from the course, writes a short story for a funder about one participant we will call Dana.
"Dana came to us without the certification local employers ask for. After training and mentoring she earned it, and she was placed in a job within 90 days of leaving the program.
'My mentor made me practise the interview until it stopped scaring me,' she told us in her exit survey. She is one of 80 people who enrolled this period; we will know at 12 months whether she is still in that job."
| Claim in the story | Kind of evidence | Where it traces |
|---|---|---|
| Came without certification | Recorded at intake | Her enrollment record |
| Earned the certification | Program record | Training record, same ID |
| Placed within 90 days | Follow-up, agreed definition | Placement survey, same ID |
| The mentor quote | Self-report, permitted for this funder | Exit survey response |
| One of 80 enrolled | Group count, unique people | Enrollment records for the period |
| Still employed at 12 months | Not yet available | Not claimed |
Notice what the story leaves out. It gives no placement rate, because Partner C's first count used six months instead of the agreed 90 days and is being recounted, and it does not say the program caused Dana's job. It ends on the honest unknown.
The same habit works for any claim. In this Foundations course example, an answer about three learners names each one, and each ID opens the record behind it.
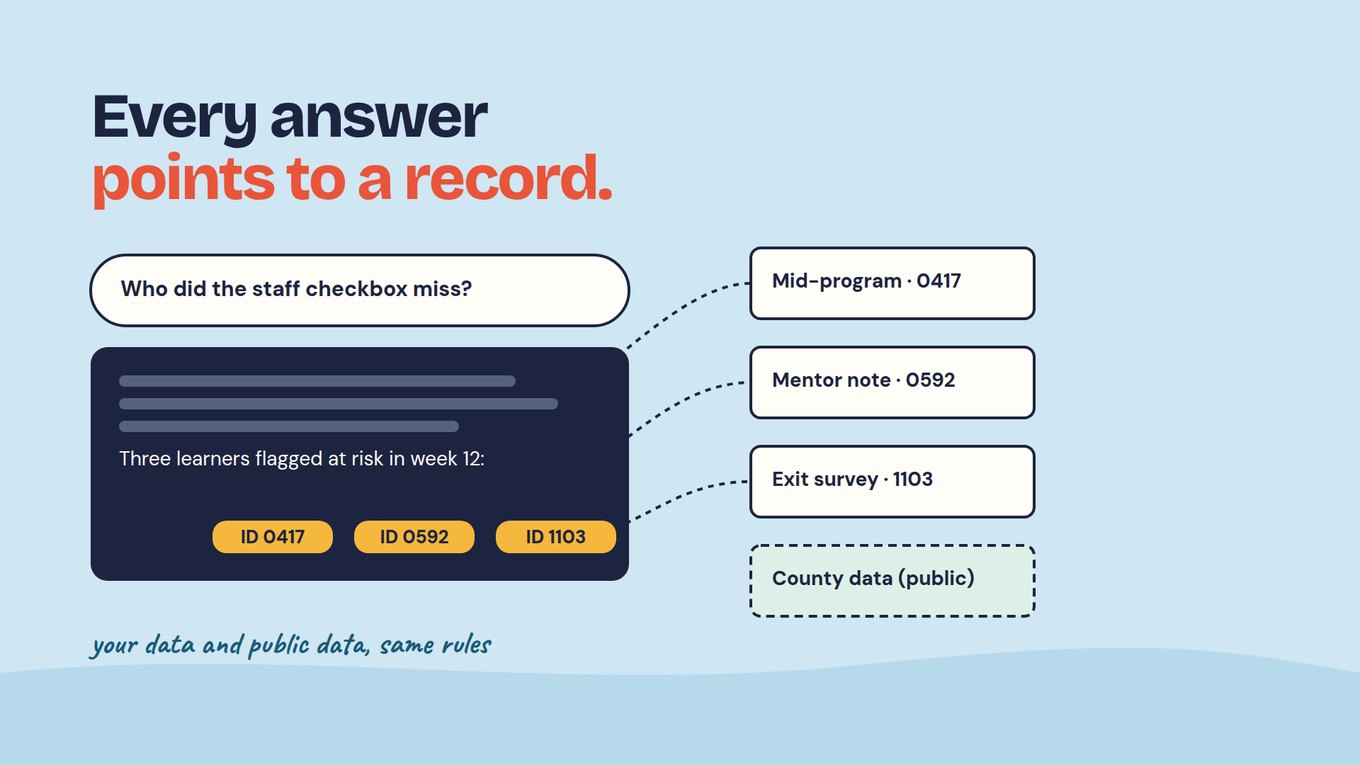
Make every number match its source shows the source note that works for story facts too.
How do you tell a story the way each funder reads?
Write down the funder's words and the proof that moves them, write down your own voice and the claims you never make, then let those two files shape the story while the facts stay fixed. The course calls these the funder's taste and your own taste.
The idea is adapted from HubSpot's book Loop, by Kipp Bodnar and Kieran Flanagan. For stories, the most useful line in your own taste file is "words we never use": in the course's Partner C file that means "beneficiaries", "life-changing", "lifted out of poverty", and no "because of our program" without a comparison that supports it.
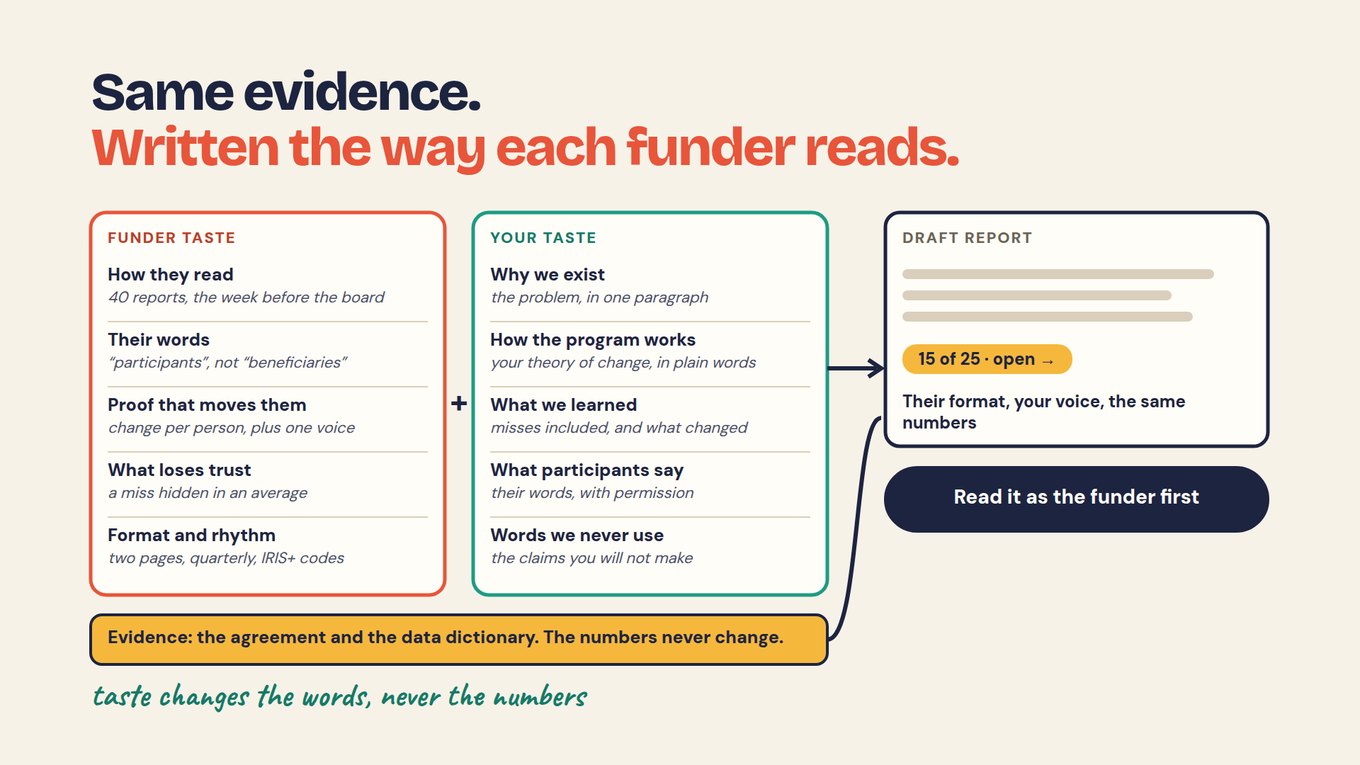
A funder who says "participants" should not read "beneficiaries" in your story. Capture each funder's taste, and your own shows how to build both files.
PROMPT · PASTE INTO CLAUDE, CHATGPT OR YOUR AI TOOL
Draft a 200-word impact story about participant [ID] for [FUNDER NAME].
Use only: the records attached for this participant, the group counts attached, the funder's taste file and our taste file.

Rules:
1. Every fact must cite the record it comes from. If a fact is not in the records, write "not in our data" instead.
2. Use only quotes marked as permitted for this funder, word for word. Never write, shorten or improve a quote.
3. Do not invent numbers, dates, feelings or causes. Do not say the program caused the change.
4. Use the funder's words. Never use anything on our "words we never use" list.
5. End with one thing we do not know yet.
Then list each sentence with its source, so I can check it.
How do you choose which stories to tell?
Decide and write down why you are choosing a story before you choose it, and look as hard for accounts that complicate the result as for those that confirm it. An unusual case can be worth telling, as long as you do not call it typical.
Consider whose voices are absent: people who left early, did not answer the follow-up or were not offered the survey in their language. A theme common among respondents may not be common among everyone served, and a count of coded comments is not a count of people. AI can suggest candidate stories and themes, but reading every response does not make a selection representative.
Choosing stories well depends on reading all the open answers, not the few someone remembers. The video below explains why qualitative analysis usually stays small, the codebook keeps changing as more answers arrive, and how to scale it without losing the thread.
How do you get permission and protect the contributor's dignity?
Ask for permission for a specific audience and use, keep that scope with the quote, and let the contributor see how they are represented. Agreeing to take part in a program or a survey is not agreeing to appear in a funder report or a campaign.
Dignified Storytelling's principles emphasize contributors' voices, freely given informed consent, accurate representation and attention to harm and power differences. Apply them through collection, editing and publication, not only at the signature.
Removing a name may not remove identity: a place, a role and an event together can reveal someone. Keep a quote's meaning when you shorten or translate it, never present a paraphrase as a quote, and use your safeguarding process with children or people in sensitive circumstances.
What can an impact story show, and what can't it?
A story shows what a change was like for one person; it cannot show how common that change was or that the program caused it.
A before-and-after change needs a comparison group or outside data on the same definition before it supports a claim about cause. Quotes are self-report, and the people who answer follow-ups may differ from those who do not. A person decides which story runs and checks every sentence against the record.
In Sopact Sense, every line of an AI Assistant answer links to a record you can open, and field selection keeps names and emails out of what the AI receives. With any other tool, keep the evidence note by hand.
Start with one story this quarter
Pick one report due this quarter and write one traced story for it, from question to evidence note.
- Name the reader and the result the story should help them understand.
- Write down, before looking, why you will choose this story and what would make you choose a different one.
- Pick a participant whose records cover the start, the change and a permitted quote, and confirm permission for this audience.
- Draft with the prompt above, using the funder's taste file and your "words we never use".
- Fill in the claims table: every sentence, its kind of evidence and its record.
- Have a colleague open each record, then send the story beside the numbers it explains.
After the first cycle you have one story a funder can check line by line, a "words we never use" list, and a claims table you can reuse for every story after it.
Frequently asked questions
What does impact storytelling mean?
Impact storytelling is telling a real experience of change in a way the reader can check. It uses a person's own words with their permission, places them beside the measured change they help explain, and keeps every fact traceable to a record. It shows what a result was like from the inside; it does not replace the result.
Does every impact story need a number?
No. An account can explain a barrier, an experience or a decision without a figure. When a story sits in a funder report, though, it usually explains an agreed metric, so place it beside that count and say who it covers. Give any statistic its population, period and source.
Can a participant story appear beside a cohort statistic?
Yes, and it usually should, as long as each is labelled. The statistic shows how common a change was; the story shows what it was like. Do not imply the person represents everyone, or that the group figure verifies every detail of their account.
Can AI write an impact story?
AI can find relevant passages, suggest themes and draft a story from records you select, with a source for each sentence. It must never write, shorten or improve a quote, and it cannot tell you whether the story is representative or whether permission covers this audience. A person chooses the story and checks every sentence.
How is impact storytelling different from impact reporting?
Storytelling follows one experience to help readers understand a change. Impact reporting gives the wider account: scope, agreed metrics, findings, limits and next steps. A story belongs inside a report, next to the number it explains. For donor-facing reports, see the donor impact report guide.