


Membership analytics brings together member records, participation, feedback and renewal evidence to help an association decide where to improve its services. A useful analysis identifies whose experience is represented, which periods and groups can be compared, and what evidence supports the next action.
For a professional association, trade body or federation, the first software question is often whether existing reporting can answer the next operational question. A member count or engagement dashboard may already work well. The gap may be recurring chapter returns, qualitative research or documents that must stay connected to the organization they describe.
Start with decisions, then choose metrics
Write down a decision and the evidence needed to make it. If attendance falls, you may need to understand relevance, timing, cost or access. Attendance records describe participation; comments and follow-up help explain the experience. Neither automatically proves the cause.
| Decision | Useful measures | Interpretation to avoid |
|---|---|---|
| Improve member value | Benefit use, reported usefulness, unmet needs and barriers | Assuming every unused benefit has no value |
| Understand renewal | Eligible renewals, actual renewals, stated reasons and membership history | Treating a satisfaction score as a proven churn prediction |
| Support local chapters | Compatible activity measures, reporting coverage and support requests | Ranking unlike chapters by one total |
| Improve events | Unique participants, attendance entries, feedback and relevant follow-up | Adding repeat visits as if they were new people |
| Report a network finding | Source records, agreed definitions, missing coverage and uncertainty | Presenting only submitted returns as the entire network |
Keep people, member organizations and events distinct
In an individual-membership association, a person may hold the membership. In a trade association, the member may be a business represented by several people. Those people can attend events or answer research questions without becoming separate organizational memberships.
Define the unit for each result. Member organizations renewing, people participating and events delivered are different measures. Use stable identifiers to connect appropriate records; keep the relationship and relevant dates. A new representative should not erase an organization’s previous returns.
Reuse registration information that remains current rather than asking for it in every survey. Confirm details that change, such as location or role, and preserve the date of the change. Otherwise a report grouped by today’s region can silently restate last year’s regional picture.
Compare local returns through a small shared core
Autonomous chapters may need different collection forms. Central comparability begins with agreement on the limited fields needed for the shared decision, not a requirement to make every local question identical.
For each shared measure, record its meaning, unit, period, eligible population, permitted exclusions and owner. Local field names can map to that dictionary when their meanings are compatible. Keep the original source and version so a reviewer can inspect the mapping.
Suppose one chapter reports unique participants while another reports attendance entries. Both may be useful, but they cannot be summed as “people reached.” Ask for a compatible measure, report them separately or explicitly describe the gap. Software cannot recover a distinction that was never collected.
A fictional comparison
| Return | Submitted value | Reporting treatment |
|---|---|---|
| Chapter Cedar, April–June | 60 unique participants; estimated | Keep the estimate flag and method |
| Chapter Maple, April–June | 140 attendance entries | Report as attendance; exclude from a unique-person total |
| Chapter Birch, January–March | 45 unique participants | Keep in the earlier period; do not combine into April–June |
The defensible answer is not “245 people reached this quarter.” It is a qualified account of the compatible evidence available and the clarification still needed. If people can attend across chapters, even aligned chapter-level unique counts may overlap; a network-wide unique total requires a suitable deduplication method and permission to use it.
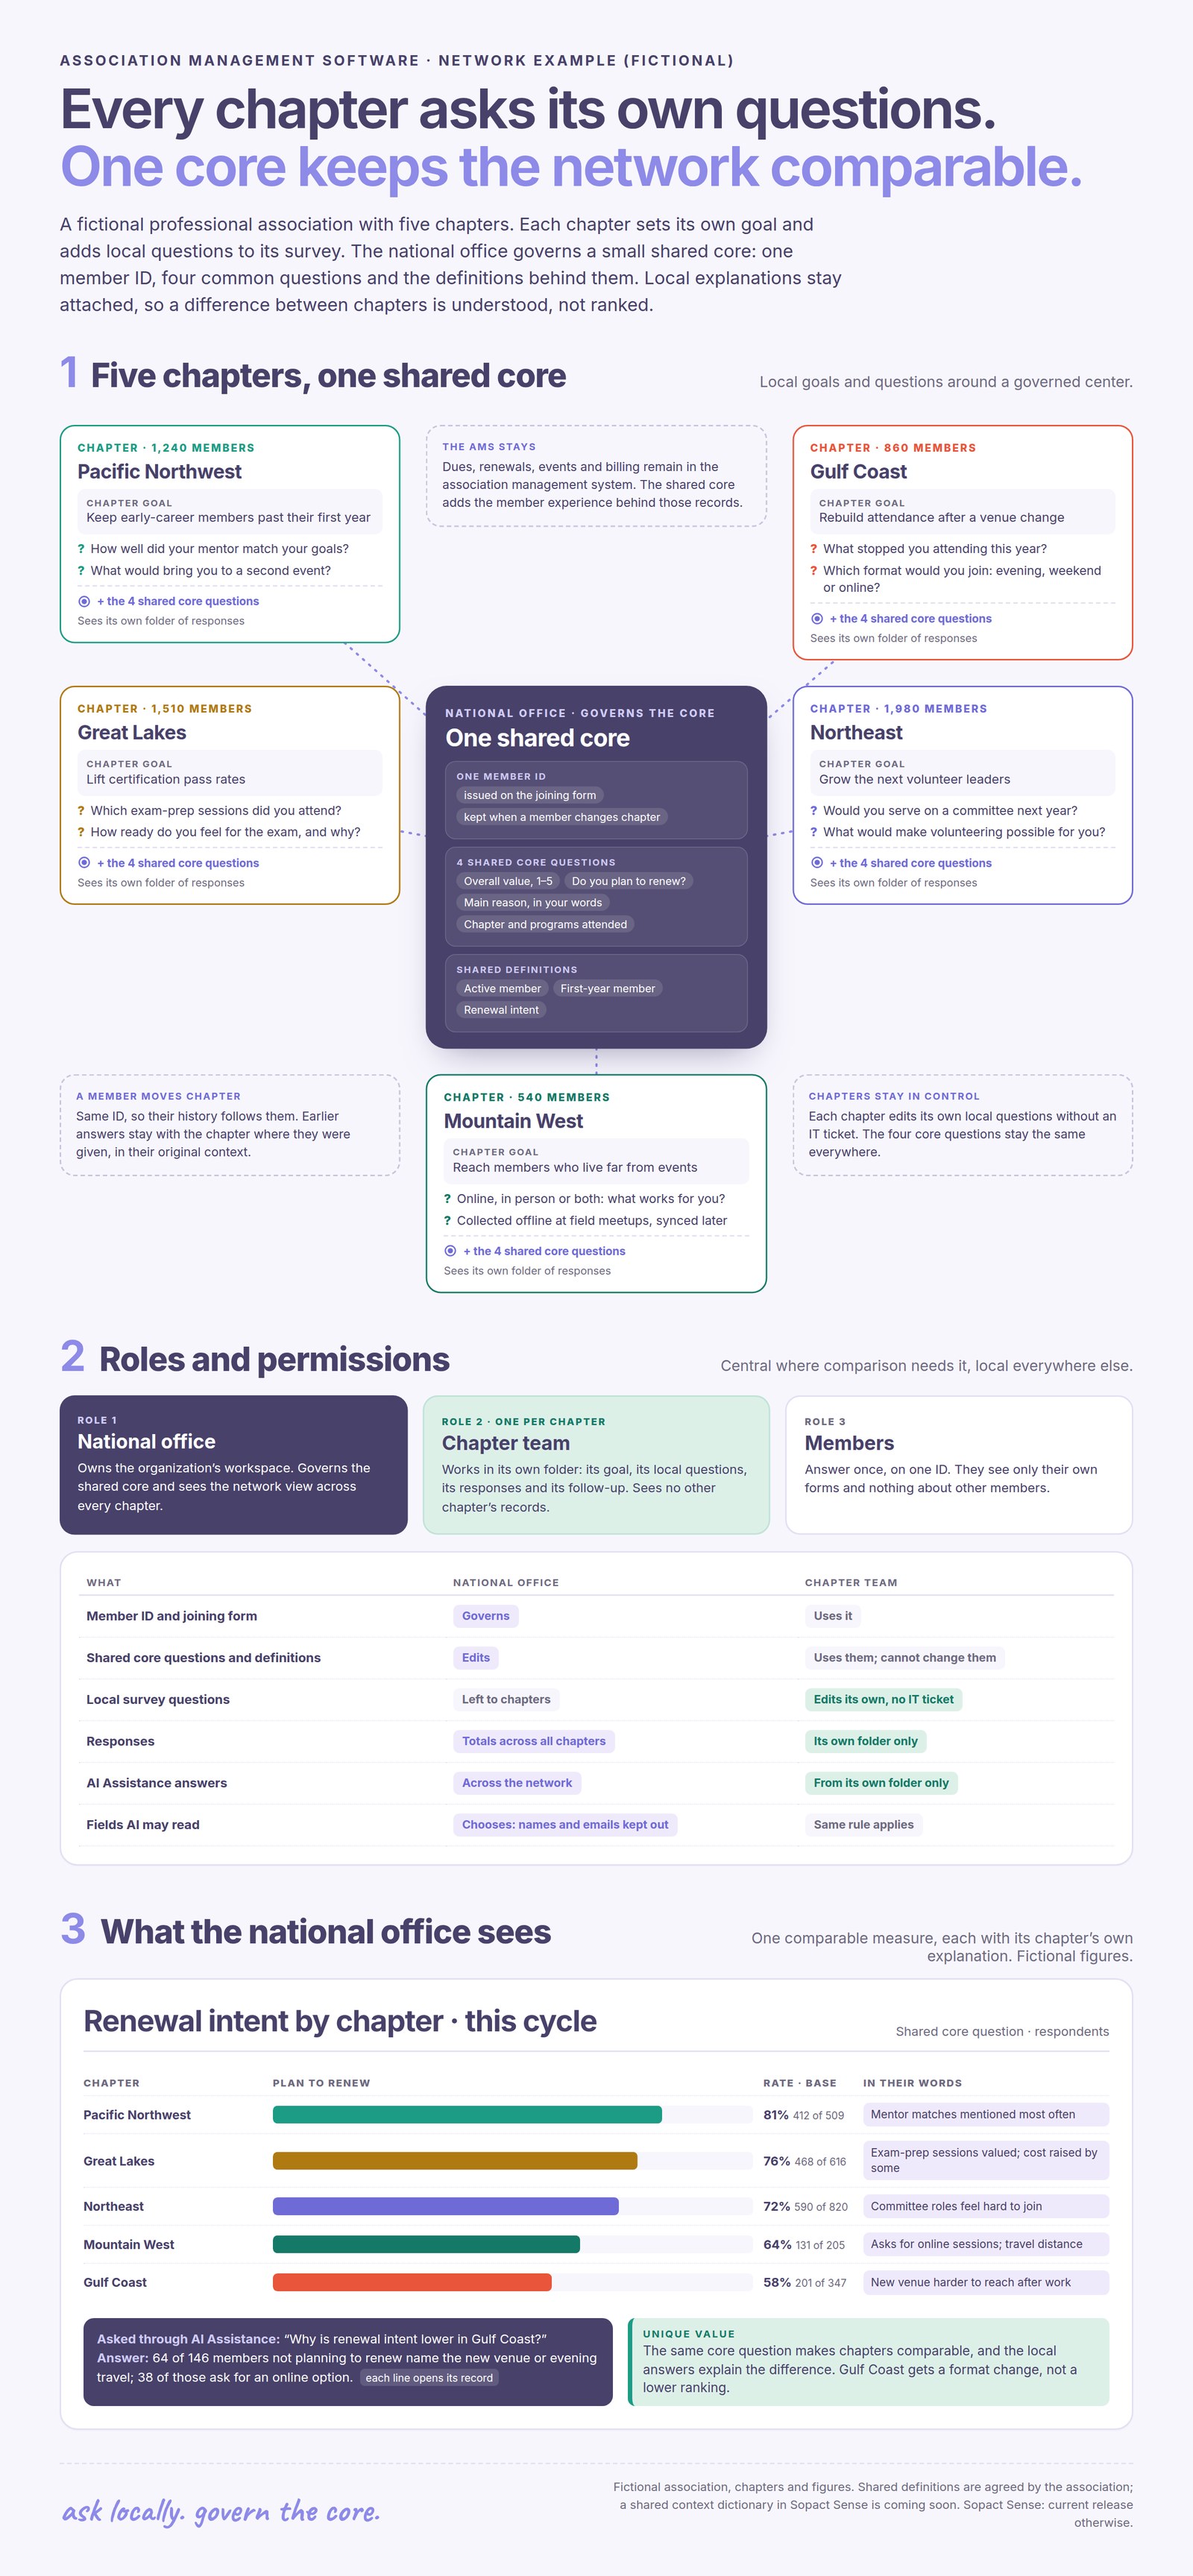
The example below takes the same principle across a whole network: five chapters with their own goals and local questions around a small governed core, and the roles that keep each chapter’s records separate.
Read engagement and retention together, carefully
Member engagement can include participation in events, use of learning resources, committee activity and feedback. The relevant signals depend on why members join. A busy executive may value industry representation without frequently attending events; a new professional may value regular learning and networking.
If you create an engagement score, show its inputs, weights and limitations. A score is a summary of selected activity, not a complete measure of member value. Test whether it systematically understates the participation of groups with different access or needs.
For retention, define the cohort eligible to renew in a specific period. Distinguish members who renewed from new members and those whose renewal date has not arrived. If you compare feedback with later renewal, keep dates and linkage permissions clear. An association can find a relationship without establishing that the reported issue caused cancellation.
What should membership analytics software help your team do?
Use a real reporting cycle to test requirements. A polished dashboard can demonstrate presentation, but it does not tell you how much work it takes to prepare and maintain the underlying evidence.
| Requirement | Ask for this demonstration | Keep as evidence |
|---|---|---|
| Connect the correct records | Change a representative while preserving the member organization’s history | Identifiers, dated relationships and an exception report |
| Handle varied collection | Receive two local forms and an external document | Original sources and the agreed field mappings |
| Review text analysis | Inspect a proposed theme against comments, including a conflicting example | Sources, reviewer changes and unresolved questions |
| Preserve comparison | Change a question and show which historical results remain compatible | Definition versions and an explicit comparison rule |
| Control access | Test central, chapter and restricted-research reader roles | Allowed and denied views, including source evidence |
| Reproduce a result | Rebuild one total from its included records | Period, filters, exclusions and a dated approved output |
| Let the operating team maintain it | Have a trained staff member correct a mapping and run the next return | Time, assistance required and maintenance steps |
Choose the part of the workflow that needs to change
Membership administration, survey research, community activity and cross-source analysis have related but different jobs. Start by identifying what your current systems already do well.
- Membership administration: dues, renewal records, directories and event administration may remain in your AMS.
- Collection: forms and surveys can capture new answers; evaluate how their versions, files and respondent context are maintained.
- Reporting and analysis: dashboards can combine existing data, provided the definitions and refresh process are trustworthy.
- Recurring evidence: multiple contributors, documents, qualitative review and continuing records may need a more connected workflow.
Dedicated association platforms already advertise reporting and analytics. For example, i4a describes reporting across membership, events and payments, while Association Analytics describes cross-system association analytics. These are vendor descriptions, not independent performance tests. They reinforce why an evaluation should examine your complete workflow rather than assume other platforms cannot connect data.
Where Sopact fits
Evaluate Sopact when a growing membership or research team needs to collect recurring evidence, analyze it with its sources, retain member and event context, agree shared definitions and govern how findings are used. The practical goal is an operating team that can maintain its workflow without repeatedly rebuilding analysis from disconnected exports.
This is a narrower and more testable starting point than replacing an entire membership system. Choose one return, research cycle or event follow-up. Bring the existing sources, the intended output and an example that should be excluded from a comparison. Verify the configured collection, analysis, access and review behavior before expanding.
Self-management needs named owners and documented changes. Self-governance needs permissions, definitions and review that staff can apply. Neither means removing human judgment or assuming every AI output is accurate.
In Sopact Sense, permissions can follow the network’s structure. Each chapter team works in its own folder and sees only its own responses, including when it asks questions through AI Assistance, while the national office sees totals across chapters. The association also chooses which fields AI may read, so names and contact details can stay out of the analysis.
Run a pilot that measures the work
- Choose one recurring decision and the member groups affected.
- Record how the current process collects, cleans, joins, reviews and reports the evidence.
- Define the small shared core and the local differences that should remain.
- Test a complete cycle, including a missing field, an incompatible period and a restricted source.
- Have an operational owner repeat the workflow and return a usable result to the relevant contributors.
Compare preparation time, clarification work, review effort and ongoing maintenance. Record whether someone outside the operating team had to intervene. These observations let you evaluate total implementation work without assuming a lower subscription price means a lower total cost.
Explore Sopact for membership and networks →
Build the collection, analysis and governance plan in the course →
Use a worksheet for one reporting cycle
Before comparing software, write down one decision, the member groups involved and the reporting period. Then record the metric and its denominator, source, owner and access rule. Test a missing record or an incompatible period before relying on the result.
For each cycle, record minutes spent preparing data, clarifying returns, reviewing evidence and maintaining the workflow. Keep those activities separate so a faster dashboard does not hide extra work elsewhere.
Download the blank pilot worksheet (CSV) · See a fictional worked example (CSV)
The example illustrates how to record a decision; its values are invented and are not Sopact customer results. Use aggregated records where possible and keep personal member data in your approved systems.
Common questions
Do we need to replace our membership management system?
Not necessarily. If administration works well, evaluate the specific evidence and analysis gap first. Confirm how data can be transferred or connected, who maintains the mapping and which system owns each record.
Can chapters keep their own surveys?
Yes, where the network agrees a limited shared core and reviews whether local measures are compatible. Different questions and periods may still require separate reporting. A field mapping alone does not make results comparable.
Can one chapter see another chapter’s member data?
No. In Sopact Sense each chapter team works in its own folder and sees only its own responses, including through AI Assistance. The national office sees totals across all chapters and governs the shared core questions.
Can membership analytics predict which members will leave?
It can help explore patterns in activity, feedback and renewal history. Reliable prediction requires suitable data, evaluation and ongoing monitoring. Do not treat a dashboard flag or an AI summary as validated churn prediction.
What should a member analytics dashboard show?
Show the measures needed for the decision, their periods and response bases, relevant missing coverage and the source of the results. Include an owner and next action when the dashboard is used to manage follow-up.
Put the plan to work
Bring one recurring member reporting cycle, the sources it uses and the decision it needs to support.
Explore the membership workflow →