


What is stakeholder analysis?
Stakeholder analysis is the process of identifying people affected by or able to influence a decision, understanding their interests and needs, and deciding how to involve them. Its output is an assessment that supports an engagement plan. A power-interest map can summarize that assessment, but the underlying reasons matter more than the coordinates.
For a growing organization, the challenge is often practical: information sits with several teams, familiar contacts receive most of the attention, and the people doing the work are not always the people represented in meetings. Analysis helps reveal those gaps before a decision is made.
The assessment can remain useful for a stable project without constant changes. Review it when the situation warrants it. A new comment may add context without changing a stakeholder's influence or needs; movement on a diagram is not a measure of progress.
Start with a decision people can still influence
Define the question clearly. “Improve stakeholder engagement” is too broad to tell you whose experience matters. “Choose how regional partners submit quarterly updates” identifies a process, contributors and a decision that can change.
Write down what is fixed, what is open and who is accountable. If a reporting obligation is fixed, participants may still influence question wording, collection routes, timing and the information returned to them. Be clear about those boundaries so involvement does not create a false expectation.
Decide the level of detail you need. For an initial organization-wide assessment, groups may be enough. For a specific implementation, distinguish roles or locations when they face different conditions. Do not create a personal profile for everyone merely because the software allows it.
Identify the people missing from the obvious list
Start with those who approve, fund, deliver, use or are affected by the work. Then ask who supplies information, bears extra work, handles exceptions or may struggle to participate. Internal and external stakeholders can both matter.
Scroll horizontally to see all columns →
| Perspective | Question to ask | Example |
|---|---|---|
| Decision authority | Who can approve, change or stop the proposal? | Program sponsor or governance committee |
| Delivery | Who will operate the process and resolve problems? | Site coordinators and support teams |
| Contribution | Who provides the information or resources? | Members, suppliers or partner organizations |
| Experience | Whose work or access changes as a result? | Participants, customers or frontline staff |
| Missing perspective | Who is absent from our current contacts or evidence? | Small branches, nonrespondents or people needing another language |
Use introductions to expand the list, but do not assume that a nominated representative speaks for every experience. An organization can contain conflicting needs. A central manager may want fewer forms while a local team needs more space to explain exceptions.
Assess interests, influence and consequences separately
For each group, describe what it needs from the decision, how it can affect the outcome and how the change may affect it. Record the evidence behind the assessment and what remains unknown.
- Interest: what the group cares about and why this decision matters.
- Influence: formal authority, practical control or ability to shape adoption and delivery.
- Effect on the group: potential benefits, burden, access barriers or other consequences.
- Current position: expressed support, concerns or uncertainty about this specific proposal.
- Participation needs: the information, access and opportunity required to contribute.
These dimensions are related but not interchangeable. A positive survey score does not establish high influence. A group with little formal authority can be strongly affected. No response tells you that evidence is missing; it does not explain why.
The Office for National Statistics distinguishes power from interest and recommends reviewing the resulting placements and recording the reasons for adjustments. Use that discipline even if your assessment remains in a simple table. Source: ONS stakeholder mapping guidance.
Gather evidence without turning the exercise into another burden
Review what is already available: recent feedback, support requests, meeting records, role descriptions and operational reports. Then collect what is missing through a few focused interviews, a short survey or a practical test of the proposed process.
Useful questions include: What do you need this process to help you do? Which part creates avoidable work? What decision should the final information support? What would make it difficult for you to participate? Who else should we hear from?
Use methods appropriate to the question. A survey can show how responses vary across a reached audience. An interview can explain an unfamiliar problem in detail. Neither guarantees coverage of people who were not reached. A workshop helps discuss trade-offs, but some participants may need a private route for concerns.
Separate a stakeholder's words from your interpretation. “We cannot complete the form during peak service hours” is evidence about timing. “This group resists change” is a judgment that the comment does not establish. Keep the original source available to authorized reviewers.
Worked example: regional service partners
A fictional business works with 24 regional service partners and wants to introduce a quarterly evidence return. The proposed form requests completion counts, service issues and a supporting document. An initial review hears from central leadership and four large partners.
The early conclusion is that a single online return will be straightforward. Further analysis identifies smaller partners that rely on part-time coordinators, partners with different local reporting definitions and site teams that produce the supporting evidence but were not consulted.
Scroll horizontally to see all columns →
| Finding | Evidence or gap | Resulting decision |
|---|---|---|
| Counts use different units | Some partners count visits; others count completed service cases. | Agree the shared measure and retain local fields separately. |
| Upload responsibility is unclear | Coordinators submit the return, but site teams own the documents. | Name a contributor and reviewer for each evidence type. |
| Smaller partners are underrepresented | Only one of eight smaller partners joined the first review. | Offer another time and route; test the form with additional smaller partners. |
| Leadership wants a comparative report | The first draft lacks period and eligibility rules. | Define the denominator and comparison limits before building the dashboard. |
The analysis leads to a smaller shared core, clearer responsibilities and a broader pilot. It does not require identical local forms. Partners can retain questions needed for their own work, provided the fields used for aggregation have agreed meanings.
If 12 of the 24 partners respond to the pilot, report 50% partner coverage. If nine of those 12 say the revised instructions are clear, report nine of 12 respondents, not “75% of the network.” Inspect which partners remain missing before treating the result as a basis for rollout.
Make the assessment usable: a simple register
A practical register can be brief. Keep these fields for each relevant group:
- Group, role and the decision being considered.
- Needs, concerns and likely effects of the change.
- Influence and interest, with a short reason rather than an unexplained score.
- Evidence source, date and gaps.
- Proposed involvement, responsible owner and next step.
- Review trigger and the reason for any later change.
Use “unknown” when you lack evidence. When reviewers disagree, record the difference and decide how to clarify it. Avoid combining every dimension into one score that hides the reason for attention.
For a visual summary, use the stakeholder mapping guide. Keep the register available behind the diagram so a reviewer can understand why a group was placed there.
Connect analysis to collection, governance and action
The next step is an engagement plan: who you will involve, what you will ask, how they can contribute and what you will return. Choose questions by role using the stakeholder question examples, then define a review and response process with the feedback guide.
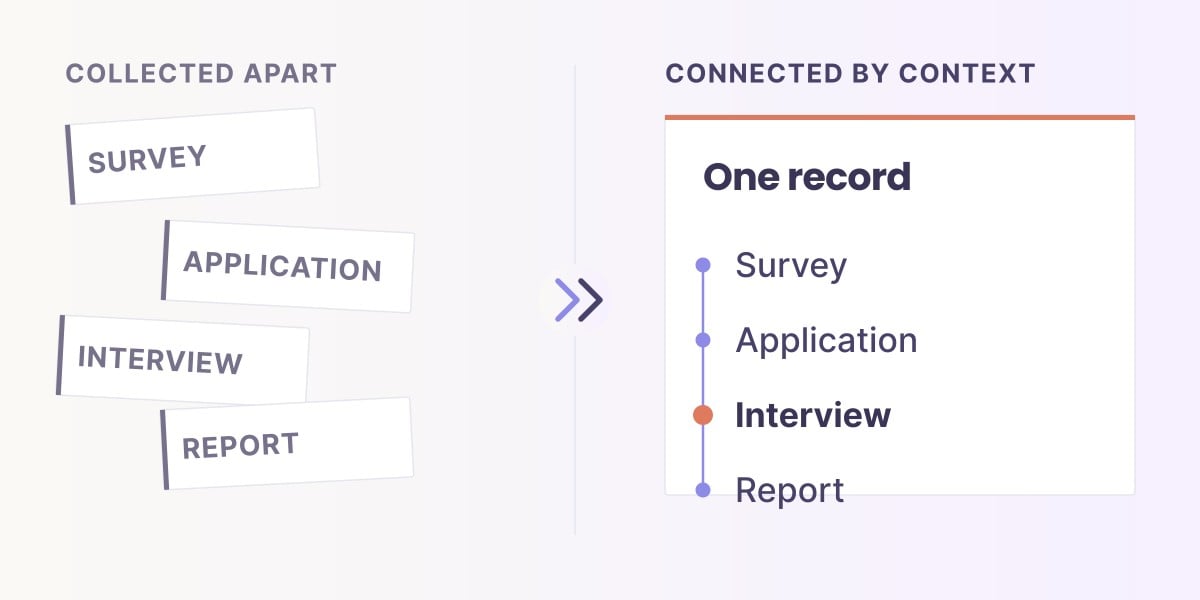
Keep routine context such as organization and role consistent where linking is appropriate. Preserve local variation in questions that do not need aggregation. Document the small shared core, period definitions, access and correction process so later comparisons remain understandable.
Tell contributors who can see their input. A private concern should not automatically appear in a partner-facing dashboard. Anonymous feedback can inform a group assessment without being joined to a personal record. Do not promise anonymity if free text or a very small group makes identification possible.
Assign an owner to material findings. Record the action, decision date and whether a follow-up is needed. Reporting back should explain what changed and why, including situations where a request could not be adopted.
Where AI-assisted analysis can help
When feedback arrives across many returns, AI can help organize comments, locate relevant passages and draft a summary for review. It can reduce some reading work while leaving the team responsible for interpretation.
Review ambiguous statements, minority views and contradictions. Several comments using similar words may describe different problems; one detailed concern may be important even if few people mention it. Frequency is one signal, not a complete priority rule.
Sopact's relevant role is connecting collection, analysis and governance so a team can review recurring stakeholder evidence with its context. Test the ability to inspect sources, maintain definitions and control access. Do not assume that an AI-generated sentiment automatically updates a stakeholder's influence or that every product implementation includes mapping alerts.
Start with a representative sample and compare the summary with a manual reading. Record omissions and unsupported interpretations, correct the process and repeat the review before relying on it for consequential decisions.
Watch the collection approach in practice
This companion video introduces AI-native data collection. Use it to consider the collection workflow behind an assessment; it is not a demonstration of automated stakeholder-power scoring.
Frequently asked questions
What should a stakeholder analysis include?
Identify the relevant people and groups, their interests and needs, how they influence the decision, how it affects them, the evidence behind the assessment and a practical involvement plan.
Is stakeholder analysis only for project managers?
No. Membership, operations, customer, employee and program teams can use it whenever a decision involves different groups. The scope should match the actual decision rather than cover everyone in the organization.
Can we analyze stakeholders without a survey?
Yes. Existing evidence, interviews, workshops and observations may be suitable. Use a survey when it helps answer a defined question, and check who the chosen method does not reach.
Does every new response require a revised assessment?
No. Review new evidence for significance. A change in role, an overlooked effect or a substantial concern may justify revision; another similar comment may simply strengthen an existing finding.
How do we know the analysis was useful?
Look for better coverage of affected groups, clearer decisions, fewer unresolved assumptions and visible follow-through. Completing a grid or collecting a large number of comments is not enough on its own.
