


What is stakeholder mapping?
Stakeholder mapping is a visual way to organize the people and groups connected to a decision, using dimensions such as influence, interest or how strongly they are affected. It helps a team decide whom to involve, what to ask and how to keep people informed. The map summarizes an assessment; it does not replace listening to the people concerned.
A common approach is a power-interest grid. Power describes someone's ability to shape the decision; interest describes how much attention or concern they have about it. Neither tells you, by itself, how much harm or benefit a decision could bring to them. Record that separately.
This guide shows how to build a usable map, document the reasons behind it and turn it into a collection and engagement plan. The example is a fictional membership network changing its annual reporting process, but the approach also applies to service programs, partner networks and business projects.
Choose a map that fits the question
Start with the decision, not the diagram. “Our stakeholders” is usually too broad. “Who should help design and test the new reporting process?” gives you a manageable boundary and a reason to act on the result.
Scroll horizontally to see all columns →
| Approach | Useful for | Watch for |
|---|---|---|
| Power and interest | Planning involvement around a specific decision | People with little formal power may still be deeply affected. |
| Influence and impact on the group | Separating decision-making influence from consequences | Define “impact” clearly so it is not confused with the group's influence. |
| Relationship map | Understanding connections between organizations, sites and representatives | A contact network does not show whether those contacts represent everyone. |
| Power, legitimacy and urgency | Discussing competing claims that need attention | A three-part assessment needs reasons, not labels assigned from reputation. |
You do not need all four. Use the simplest representation that helps the team make a better decision. The Association for Project Management includes stakeholder identification and analysis within engagement planning; the map is one part of that work. Source: APM stakeholder engagement guidance.
How to use a power-interest grid
Agree what high and low mean for this decision. For example, high power could mean authority to approve the reporting standard, control the resources needed or materially affect adoption. High interest could mean the reporting process is central to the group's work or the group has expressed a strong concern.
Scroll horizontally to see all columns →
| Lower interest | Higher interest | |
|---|---|---|
| Higher power | Keep appropriately briefed. Clarify what decisions or risks require their involvement. | Work closely on the decision. Agree responsibilities, evidence needs and a review schedule. |
| Lower power | Keep an accessible route to participate. Check that apparent low interest is not a barrier to participation. | Make participation practical. Seek experience and concerns, explain how input affects the decision and report back. |
These are starting responses, not fixed rules. A person with limited decision-making power should not receive less protection or fewer opportunities simply because of their position on a grid. A highly affected group may need active involvement even when its members have not attended a meeting.
Keep support or opposition separate from interest. Someone can be strongly interested and supportive, strongly interested and critical, or uncertain. A critical comment is not evidence that a group has gained formal power, and a positive comment is not evidence that its concerns have disappeared.
Build the map in six steps
1. Define the decision and its boundaries
Write a sentence describing what can still change. If the reporting deadline is fixed but the form and support process are open for discussion, say so. Do not ask people to help decide something that has already been settled.
2. Identify affected people as well as familiar contacts
List internal teams, contributors, decision owners, people affected by the outcome and relevant partners. Ask who is absent from the list. In a network, central staff may know chapter leaders but miss the volunteers who complete the return or the members whose information it contains.
3. Gather enough evidence to make a first assessment
Use role descriptions, earlier feedback, interviews and operational experience. Record what is known and what is a working assumption. A brief conversation can reveal that the named representative is not the person doing the work.
4. Place groups and explain the reasoning
For each placement, write a short reason and the date it was reviewed. If two reviewers disagree, keep the disagreement visible until you can clarify it. A precise-looking numerical score does not make a subjective judgment more reliable.
5. Check the map with people who know the work
Ask representatives whether the proposed involvement is useful and feasible. Check language, access, timing and whether one representative can reasonably speak for the group. Offer another route for views people may not want to share in a group setting.
6. Assign actions and a review trigger
Give each engagement action an owner and a purpose. Review the map when responsibilities change, a new group is affected, significant feedback arrives or the project reaches a decision point. A calendar reminder can supplement these triggers; it is not a substitute for noticing a material change.
Worked example: a network changes its annual return
A fictional professional network is redesigning its annual member return. The central team wants comparable activity information. Local chapters want less duplicate entry, and smaller chapters need a process they can run with limited volunteer time.
Scroll horizontally to see all columns →
| Group | Initial assessment | Reason and next action |
|---|---|---|
| Reporting sponsor | Higher power, higher interest | Approves the requirements. Agree which decisions need common data before adding questions. |
| Local reporting coordinators | Lower formal power, higher interest | Complete the return. Test a draft with coordinators from different chapter sizes. |
| Members whose details are collected | Interest not yet known; potentially affected | Explain purpose and access. Ask what would make participation useful and appropriate. |
| IT support team | Influence over feasibility; interest depends on scope | Review access and import requirements before promising a collection method. |
| Board committee | Higher power, limited day-to-day involvement | Confirm the decisions the final report must support and provide a concise progress review. |
The important finding is not the number of groups in each quadrant. It is the mismatch between those approving the form and those doing the work. The next step is a pilot that includes smaller chapters, rather than asking only the most responsive large chapters to comment.
If smaller chapters do not respond, mark that gap. Do not move them into “low interest” automatically. The timing, language, invitation route or workload may explain the absence. The map should make the uncertainty visible.
Turn the map into a practical collection plan
Mapping becomes useful when it changes whom you hear from and what you collect. Give different groups questions relevant to their roles. A reporting coordinator may need to explain duplicate entry; a board member may need to identify which decisions the report should inform.
Where comparison is needed, agree a small shared core. For example, chapters might all report the period, activity type and participant count under a common definition, while collecting local details in their own format. Define whether the count represents unique people or attendance entries. One standardized label cannot resolve two different units.
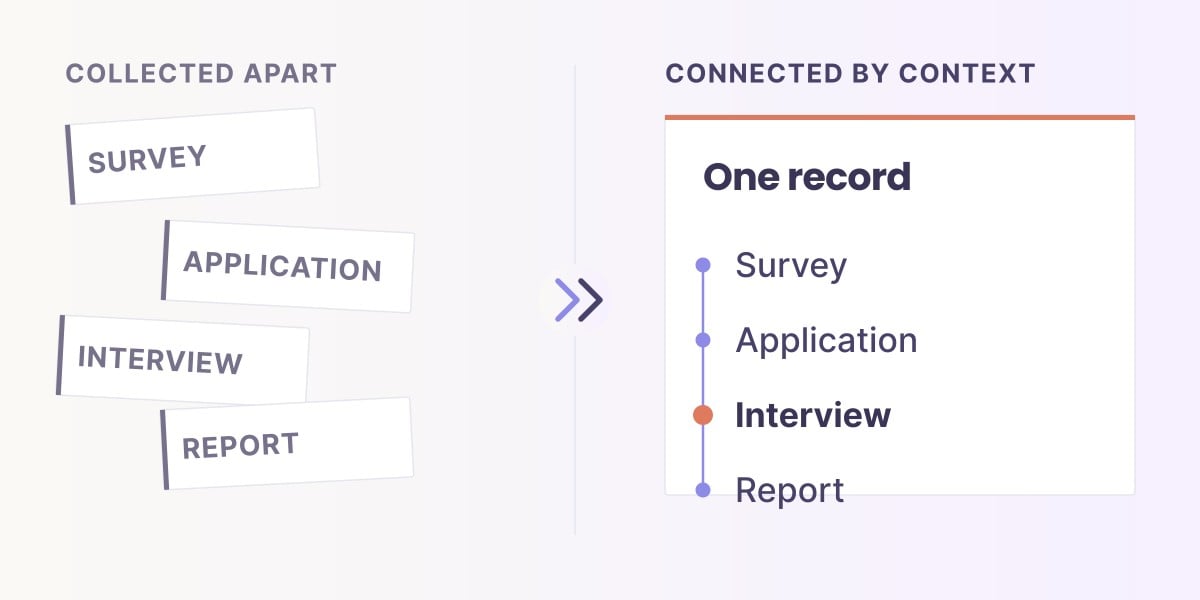
Keep registration context separate from recurring questions. Store stable organization details once, update changing contacts when necessary and preserve earlier context where it matters. You can assess group coverage without requiring every anonymous respondent to have a permanent personal record.
Use the stakeholder survey questions guide for role-specific examples and the stakeholder feedback guide for analysis and reporting back.
Keep a short stakeholder register behind the map
A diagram is easier to read than a long spreadsheet, but it cannot hold every reason or qualification. Keep a small register with enough information to explain the placement and next step:
- Group and role: who is affected or involved, without unnecessary personal detail.
- Decision context: the particular change the map covers.
- Assessment: influence, interest, effect on the group and any unknowns.
- Evidence: the source, date and reason for the assessment.
- Engagement: what you will ask, through which route and who owns it.
- Review: the trigger for revisiting the placement and a record of the decision.
Limit access to sensitive judgments. Labels about influence or opposition can damage trust if presented without context. The team may need a working assessment, while participants need a clear explanation of how they can contribute and how their information will be used.
What software and AI can help with
A whiteboard or spreadsheet is often sufficient for the first map. Software becomes useful when evidence arrives repeatedly from many groups and the team needs to keep collection, source context and review decisions connected.
AI can help organize comments or suggest issues for a reviewer to inspect. It cannot reliably infer someone's power, willingness to participate or the legitimacy of a claim from sentiment alone. It also cannot hear people who were never reached. Review suggested changes against the actual decision context.
Sopact can be evaluated for the recurring collection, analysis and governance behind the map. Test whether your team can find the original evidence, distinguish groups and periods, maintain shared definitions and control access. Confirm any map visualization or alerting requirement separately; an automatically moving power-interest diagram should not be assumed.
A useful pilot includes a changed contact, a missing group, two conflicting comments and a revised question. The team should be able to explain what changed in its assessment and why, without losing the earlier evidence. The goal is a better review process, not movement on a chart for its own sake.
Check whether the mapping improved participation
Review whether the people identified actually had a workable opportunity to contribute. Look at coverage by group, unresolved concerns, the usefulness of the information received and whether the team reported back. A large response total can still hide an absent group.
For example, receiving 90 responses from large chapters and ten from smaller chapters does not establish balanced participation. Compare those responses with the number invited in each group and consider who was not reached. Do not label the final map “representative” solely because a survey was sent.
End the review with a short account of what input changed, what stayed the same and why. That is more useful to contributors than showing them a quadrant without explaining the decision it supported.
Frequently asked questions
What is the difference between stakeholder mapping and stakeholder analysis?
Analysis examines stakeholders' roles, needs, influence and connection to a decision. Mapping presents selected parts of that assessment visually. A map is a summary of the reasoning, not a replacement for it.
Should stakeholder interest be scored from survey sentiment?
No. Sentiment describes an expressed attitude, while interest concerns attention or involvement in a particular decision. Use feedback as one source and check the context before changing an assessment.
How often should a stakeholder map be updated?
Review it at relevant decision points and when responsibilities, affected groups or important evidence change. The right frequency depends on the pace and consequences of the work.
Can one stakeholder map cover an entire organization?
A broad map can show major relationships, but specific decisions usually need a more focused assessment. The same group may have a different role or level of influence in another project.
How do we avoid excluding quieter groups?
Check who is absent, investigate access barriers and offer appropriate ways to contribute. Record uncertainty rather than interpreting silence as low interest. Keep the effect of the decision on each group visible alongside its power.
