


Related solution
Training & Programs
Connect assessments, participant feedback and later learning.
Explore the solution →

USE CASE / SOFTWARE GUIDE
Qualitative and quantitative analysis software helps teams interpret numerical measures alongside interviews, comments, observations and other narrative evidence. Good software makes it possible to examine what changed, how people experienced it and where the evidence disagrees. The aim is a more useful explanation than either numbers or narrative could provide alone.
The difficulty is connecting the evidence meaningfully. A chart may describe an entire cohort while the accompanying quote comes from one selected interview. Repeated surveys may lose the link to earlier responses, and manually coding new feedback can delay understanding until after the program has ended.
AI can help analyze incoming narrative evidence sooner, but its value depends on the context preserved around it. Sopact focuses on recurring program work: collection, related records and analysis stay connected so staff can use qualitative and quantitative evidence in current decisions and later follow-up.
See the size, distribution and timing of observed results.
Understand experiences, explanations and unexpected differences.
Use both kinds of evidence to inform the next program decision.
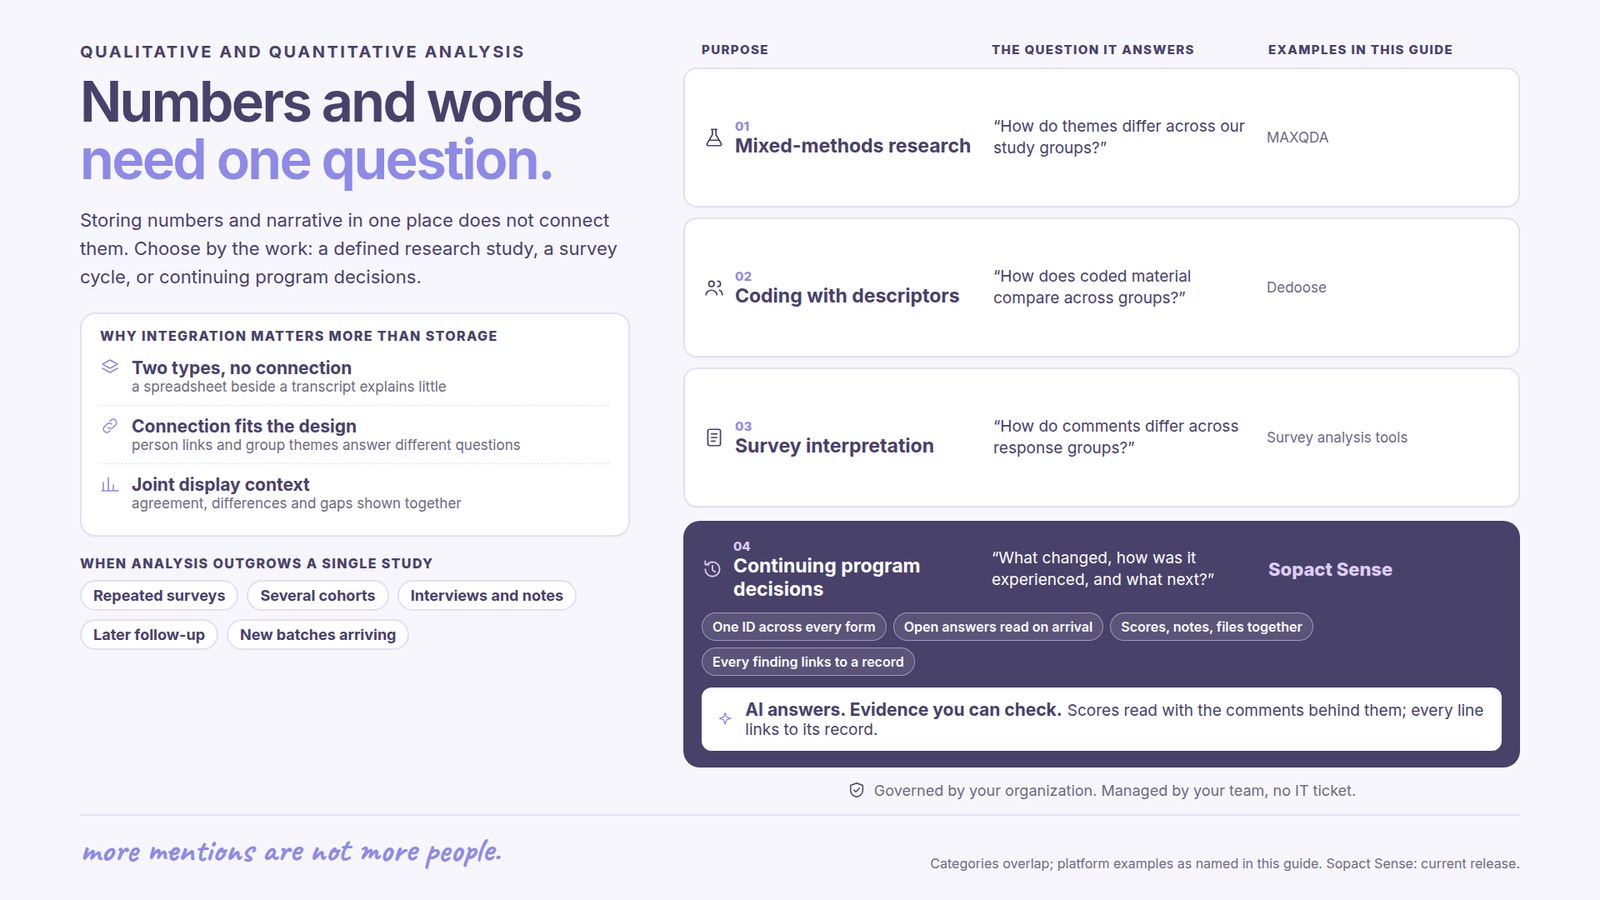
A platform can accept a spreadsheet and a transcript without helping the team understand them together. Useful integration connects the evidence around a shared question. A training team, for example, may need to understand why a strong assessment result is not followed by use of the skill at work.
The appropriate connection depends on the design. Linking a person’s assessment and later interview supports individual follow-up. Comparing themes across groups supports a different question. A study can also integrate separate qualitative and quantitative findings at the level of interpretation; every finding does not have to originate from the same person.
A joint display is one way to make that relationship visible: it presents numerical findings and relevant qualitative evidence together so readers can examine agreement, differences and gaps. The software should preserve enough context to explain what the comparison means.
Researchers may need detailed coding, memos, group comparisons and joint displays within a defined study. The methods and interpretive decisions are central. Specialist research software can be the right choice even when collection takes place elsewhere.
A team with ratings and open responses may mainly need to understand how comments differ across response groups. The scope can remain within a survey cycle. The survey analysis software guide addresses that narrower purchase.
Training, case, grant and membership teams may need to use new feedback alongside intake information, assessments, notes and later follow-up. Sopact is designed for this continuing evidence context. The value is availability during the work, rather than a separate analysis project after every cycle.
The MAXQDA manual documents joint displays, comparisons of qualitative themes across quantitative groups, and conversion of code frequencies into variables. Its mixed-methods overview also describes statistical tools and AI Assist. This is substantive support for research integration, not merely a text-coding tool. It suits teams whose main need is to develop and examine a mixed-methods study.
Dedoose’s descriptor model attaches structured characteristics to media and uses them in analysis. This helps researchers compare coded material across groups or other relevant attributes. The buying consideration is how well that project-based analysis supports the study and the team working on it.
Sopact connects structured measures with feedback, notes and documents in their participant and program context. Incoming analysis remains available through AI Assistance for continuing questions. Its fit is strongest when program staff need evidence during delivery and across reporting periods.
These approaches overlap. Choose around the work the team must sustain, including how new evidence arrives, which analysis methods matter and who will own the process. The qualitative analysis software guide covers a wider research-tool shortlist.
Suppose a training program records high completion and positive satisfaction, but later comments describe limited opportunity to apply the learning. The numbers establish participation and reported experience; the comments raise a different question about use at work. Reading them together can prompt follow-up with learners or changes to employer support.
Sopact analyzes new evidence as it arrives in the configured workflow and keeps the analysis connected to related records. Staff can use AI Assistance to explore the comments alongside earlier goals, assessments and later observations. This reduces the repeated preparation needed to answer the next question.
The same evidence can support several levels of work. A mentor needs context for a conversation; a program lead needs patterns across participants; leadership needs a clear account of results. Connecting the evidence helps each audience understand the program without preparing a separate collection of source files.
One person may mention the same issue several times. A report should distinguish coded passages from people and explain the population behind a percentage. More mentions do not automatically mean more affected participants.
A high rating can coexist with a serious concern about accessibility. An improved assessment can coexist with low confidence. Software should help the team inspect those differences instead of blending them into one favorable summary.
Results among respondents do not describe every enrolled participant. Keep coverage visible, and distinguish repeated observations from a new cohort. This makes the finding more useful when staff decide whether to adjust support or collect additional evidence.
A shared data dictionary explains measures, groups, collection periods and terms such as completion or progress. Qualitative interpretation also needs the question asked and the circumstances in which an answer was collected. A short comment and a long interview offer different depth; their length alone does not establish importance.
For example, a completion measure may cover everyone who enrolled, while a confidence question covers only people who answered an exit survey. If those populations are not clear, an attractive combined report can imply more than the evidence supports. Context makes both the analysis and its limits understandable.
Sopact’s value is connecting these definitions and sources with recurring program evidence. The team can explore the material and inspect supporting passages, while retaining responsibility for interpretation. Automatic analysis can reduce preparation; it does not establish causation or replace a research design.
Research teams should prioritize the methods and analytic control their study requires. Program teams should prioritize whether incoming evidence can inform support and reporting without repeated assembly. Neither purchase is improved by a longer feature list that ignores the actual work.
Sopact’s typical setup estimate is two days to two weeks for an agreed scope. The initial sources, program questions and historical context shape that scope. Self-governance, personalization and continuing support help staff adapt the evidence practice as their programs change.
The practical outcome is a clearer explanation of what is happening and why it matters. For extended follow-up with the same participants, the longitudinal data collection guide explains the additional continuity requirements.
It supports interpretation of numerical findings alongside narrative evidence such as interviews, comments and notes. Useful integration connects both to the question being answered.
No. Some designs link evidence for the same participants; others integrate group-level or separate study findings. The connection and scope of the interpretation should be clear.
It brings qualitative and quantitative findings together in a structured view so researchers or program teams can examine agreement, differences and gaps.
No. AI can assist analysis and preparation. People still choose an appropriate design, interpret evidence and judge what the combined findings support.
Sopact is relevant when incoming forms, feedback, notes and documents need to remain connected to program context and support recurring decisions, follow-up and reporting.
Continue with a purpose
Related solution
Connect assessments, participant feedback and later learning.
Explore the solution →Continue learning
Explore how numbers and narrative inform program understanding.
Start learning →
Customer story
Analysis revealed stakeholder priorities in feedback previously used mainly as stories.
Read the story →See how Sopact can make recurring qualitative and quantitative evidence useful to your program team.
See it with your workflow →