


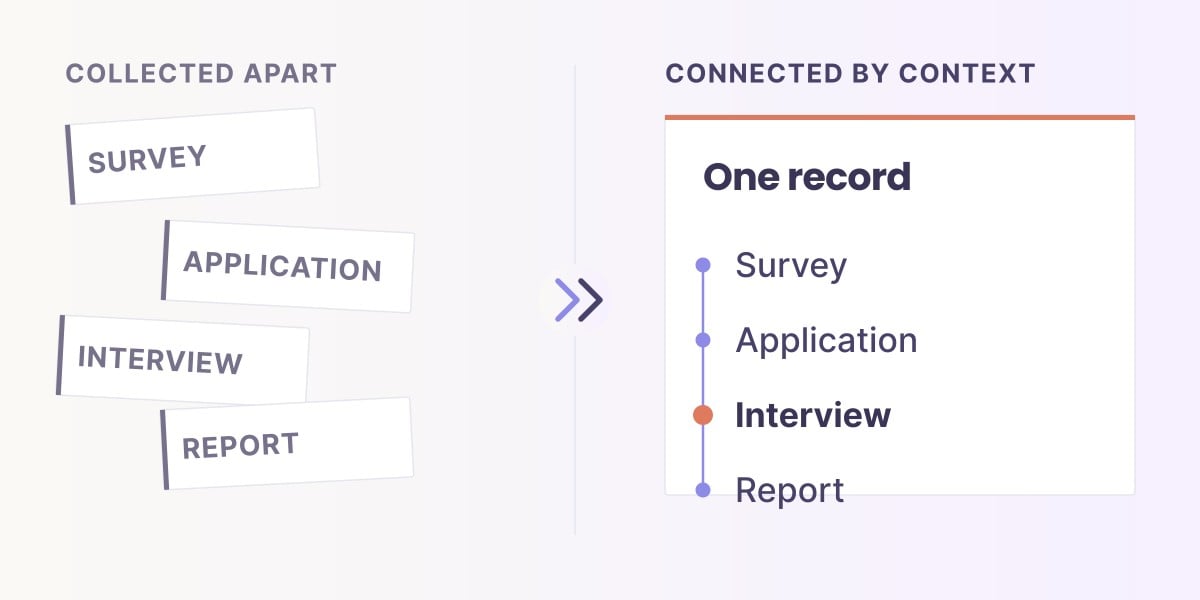
What does a good logframe example show?
A good logframe example shows a program's matrix filled in, then follows it into the first results review, so you can see which reported numbers can be used, which must be held and why. A filled matrix alone teaches layout; the review teaches judgment.
This page works two full examples and three shorter starters. All are fictional teaching cases, not customer results or benchmarks. To build your own from blank cells, start from the logframe template.
THE SHORT VERSION
- In both worked examples, the matrix is only as useful as the definitions and sources behind its indicators.
- When results arrive, a number counted differently from the logframe is held, not added, and a missing follow-up is unknown, not a failure.
- Borrow an example's structure and reasoning, never its numbers or targets.
How would a job-training fund fill in a logframe?
A fictional regional workforce fund, which funds four job-training partners (A, B, C and D), turns the change model from its onboarding call into this matrix, with the five agreed metrics as indicators. It is the running example in Sopact's free course on measurement and reporting.
On the call, the fund and its partners agreed one chain: training and mentoring lead to certification, then placement within 90 days, retention at 12 months and, over time, living-wage jobs. Each link became a row.
Scroll horizontally to see all columns →
| Level and narrative | Indicator | Means of verification | Assumption |
|---|---|---|---|
| Goal: graduates in living-wage jobs | Starting wage, hourly, by track (annual) | Placement survey | Suitable jobs stay within reach |
| Purpose: graduates placed and still employed | Placed within 90 days of exit; retained in the same job at 12 months (annual) | Placement survey; 12-month follow-up | The job fits the person, so they stay |
| Outputs: trained, certified participants | Enrolled, unique people not visits (quarterly); completed training | Enrollment form; completion record | Employers recognize the certification |
| Activities: training and mentoring | Not in the reporting agreement | Program records | Content matches what local employers hire for |
Two choices make this matrix work. Every indicator carries its window or unit (unique people, 90 days, 12 months, by track), and every source is a form or record rather than “partner report”. Without those, the next section would be impossible.
What happens when a partner's report is read against this logframe?
Each indicator gets one status (matches, different, missing or not split), and only the matches go into the portfolio total. Partner C's first report shows all four.
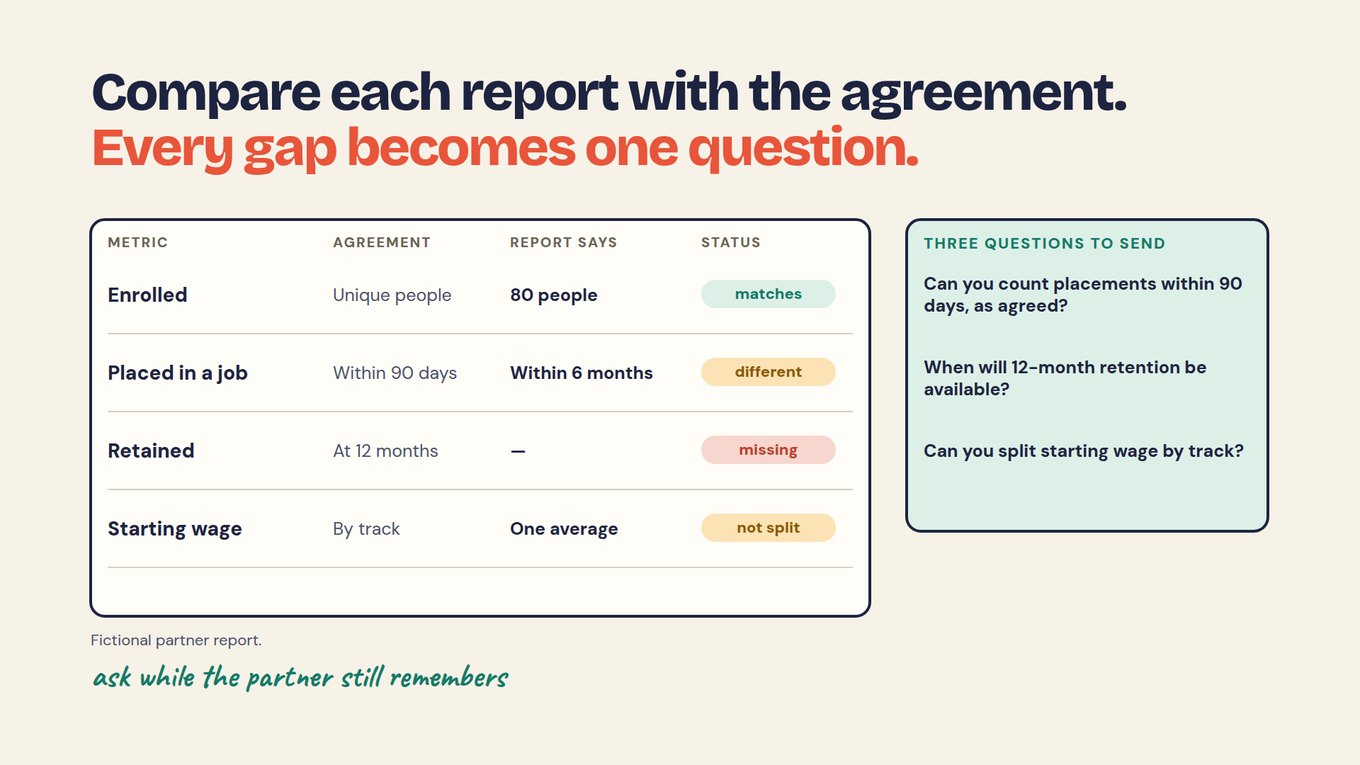
The status is only half the review. The other half is what the fund can honestly say this quarter, row by row.
Scroll horizontally to see all columns →
| Indicator | Partner C reported | Status | What the fund can say |
|---|---|---|---|
| Enrolled | 80 people | Matches | 80 unique people enrolled; can be added |
| Placed within 90 days | 55, within six months | Different | Held; portfolio total is 100, from A, B and D |
| Retained at 12 months | Not reported | Missing | Nothing yet; ask when it will be available |
| Starting wage by track | One average | Not split | No comparison by track until it is split |
The 100 comes from Partner A's 42, B's 31 and D's 27, all counted within 90 days. Partner C may have placed more people than anyone; nobody can tell until it confirms the 90-day count, so its 55 stays out of the total with a note saying why. The chapter Roll up and benchmark portfolio results shows how to report a held number.
In Sopact Sense, an Intelligence Cell can read each partner report on arrival with a prompt your team configures, and every line of an AI Assistant answer links to a record you can open before a question goes to the partner.
What does a logframe look like for a short training course?
Example 2 is a fictional professional network running a four-workshop course for 100 enrolled participants, where the purpose is that participants use a taught workplace practice within three months. Its matrix sets targets, which makes the later review sharper.
Download Example 2 — CSV for Excel or Google Sheets →
Scroll horizontally to see all columns →
| Level and narrative | Indicator and target | Means of verification | Assumption |
|---|---|---|---|
| Goal: more effective professional practice | Choose a measure before setting any target | A later assessment, participant and employer evidence | Other influences shape performance |
| Purpose: participants apply the practice within three months | 60 of 100 enrolled report defined use; follow-up reaches at least 80 | Three-month follow-up linked to the enrolled cohort | Participants get a chance to apply it |
| Outputs: participants complete the course | 80 of 100 meet the completion requirements | Completion records | Participants can attend every session |
| Activities: deliver the workshops | Four workshops by the end of month two | Session records | Facilitators and materials are available |
The goal row has no number on purpose. A decorative target is worse than an honest open choice. The baseline for workshops is zero, but participants do not start with zero practice, so any claim of an increase needs a starting observation.
How do you review Example 2's results without overstating them?
Keep the denominator the target used: 36 of 100 enrolled have a recorded report of use, which is below the planned 60, even though 36 of the 60 who answered is 60%. In the fictional review, four workshops ran, 84 people completed, 60 answered the follow-up and 36 reported use.
Scroll horizontally to see all columns →
| Measure | Plan | Observed | What the reviewer can say |
|---|---|---|---|
| Workshops delivered | 4 | 4 | Delivery target met |
| Course completion | 80 of 100 | 84 of 100 | Completion target exceeded |
| Follow-up coverage | 80 of 100 | 60 of 100 | Coverage below plan |
| Known reported use | 60 of 100 | 36 of 100 | Planned level not shown; 40 people unknown |
The opposite overstatement is also wrong. The 40 who did not answer are unknown, not 40 people who never used the practice, so the review reports 36 known uses and 40 unknowns side by side.
Suppose 12 respondents say they had no chance to apply the practice. That tests the purpose row's assumption directly and suggests working with employers next cycle, but it does not explain the 40 who stayed silent.
The video below argues that a logframe breaks when it stops being checked against evidence. Watch for the moment the plan column and the observed column are read together, as in the table above.
What would a logframe look like in other sectors?
The same four rows work anywhere, but each sector has its own trap between the output and the outcome. Examples 3 to 5 are starting points, not indicators to copy.
Scroll horizontally to see all columns →
| Example | Possible output | Possible outcome question | Source issue to settle |
|---|---|---|---|
| 3. Member network | Chapters submit a defined annual return | Do chapters use the returned analysis for a local decision? | Different local forms need a small shared dictionary |
| 4. Service program | Appropriate referrals are made | Do participants reach useful support? | A referral sent is not support received |
| 5. Partner development | Partners complete an agreed improvement activity | Is the practice put in place and kept? | A self-reported action may need supporting evidence |
Choose each result and source with the people who deliver the work and the people it is for. The IFRC planning manual and the European Commission's logical framework guidance have more sector formats.
Can the same example be shown as a theory of change or results framework?
Yes: Example 1's rows move straight into any other format, because goal and purpose are impact and outcomes under different labels. As a results framework, living-wage jobs becomes the strategic objective, placement and retention the intermediate results, and training and mentoring the sub-results.
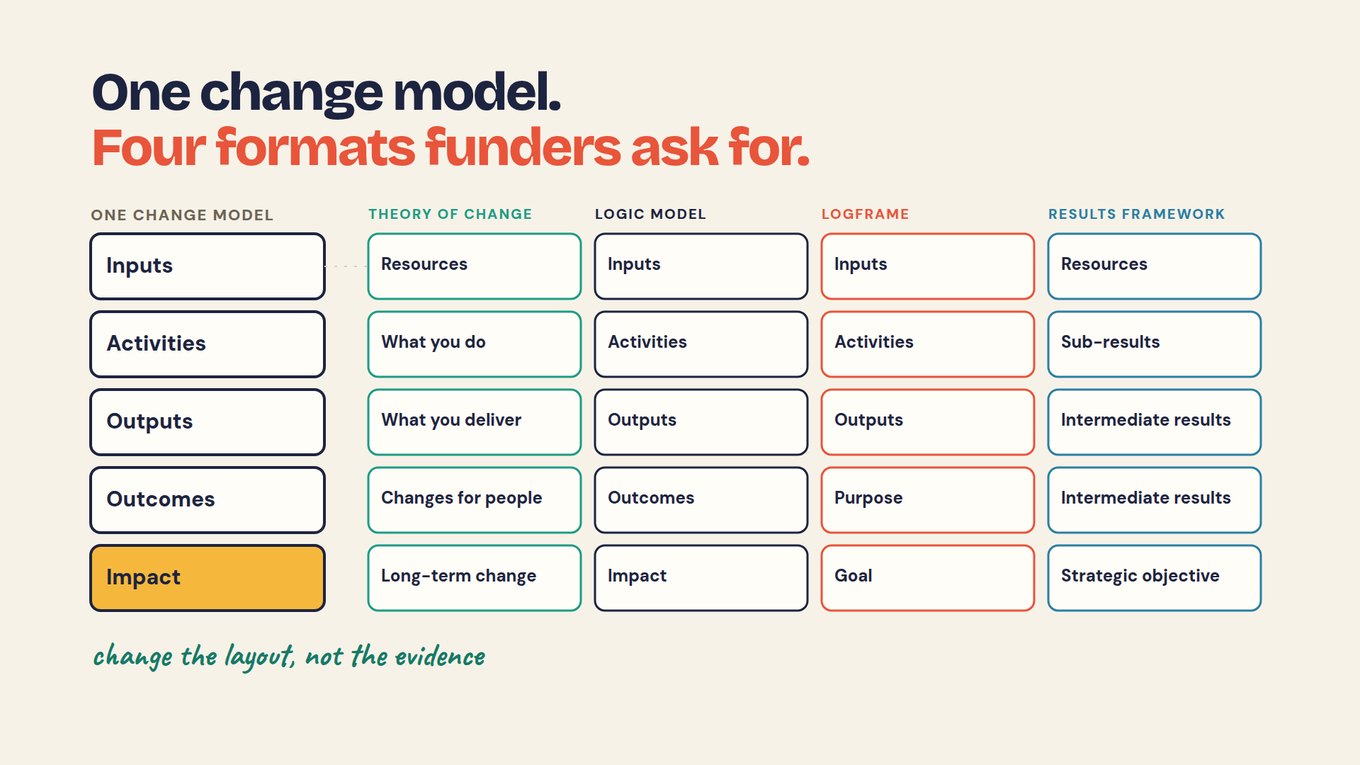
That is why the fund can answer a funder who wants a theory of change and another who wants a logframe from the same records. The chapter One change model, four formats lays Example 1 out in all four.
What do these logframe examples not show?
They show how to plan and read evidence, not whether either program worked. Enrolled and completed are outputs; placement, retention and reported use are outcomes that also depend on employers, managers and people's lives.
A rise in placements or reported use is not proof of cause without a comparison, such as earlier cohorts or an outside figure on the same definition. Reported use is self-report, and non-response can tilt any rate. If an AI tool drafts a review, a person checks every line against the records and decides what it means.
How do you adapt an example to your own program? Start with one row
Pick the example closest to your work, copy its structure, and rebuild one purpose row with your own definition and source before touching the rest.
- Choose Example 1, 2 or one of the sector starters, whichever has the nearest output-to-outcome step.
- Rewrite the purpose row for your people, with a time window.
- Write one indicator definition and name the form or record it will come from.
- Write the assumption that could break the link, and who will watch it.
- When the first report or follow-up arrives, fill a “what we can say” column like the Partner C table.
PROMPT · PASTE INTO CLAUDE, CHATGPT OR YOUR AI TOOL
Below is an example logframe and a description of our program. Adapt the example's structure to our program.

Rules:
1. Keep the four rows and four columns. Replace every narrative, indicator, source and assumption with ours.
2. Do not carry over any number, target or time window from the example. Use only what our description states; otherwise write "not in our data".
3. For each indicator, give a one-line definition: who is counted, what qualifies, over what window.
4. Name a form or record as each means of verification, never "report".
5. After the table, list the three cells you are least sure of and why.

Example logframe:
[PASTE]
Our program:
[PASTE]
After one cycle you have a purpose row you can defend, a first “what we can say” table and a clear list of what to define next.
Frequently asked questions
Are these logframe examples from real programs?
No. Example 1, the regional workforce fund and its four partners, is the fictional running example from Sopact's course on measurement and reporting. Example 2 and the three sector starters are fictional teaching cases too. The numbers, targets and results illustrate the method; they are not customer outcomes, validated benchmarks or recommended targets for your program, so set your own from your evidence.
How is a logframe example different from a template?
A template gives you blank cells with a prompt in each. An example shows those cells filled for a specific program and, on this page, follows them into a results review, so you can see how the choices hold up. Use the logframe template to draft your own, and an example to check your reasoning.
Does every logframe row need a numeric target immediately?
No. Do not invent a target to fill a cell. Example 2 leaves its goal row without one until the team chooses a meaningful measure and a feasible source. Establish the indicator, baseline and evidence plan first, follow your funder's planning process, and mark any unresolved choice clearly rather than hiding it behind a number.
Why are the response rate and the outcome rate kept separate?
They answer different questions. Coverage says who is represented: in Example 2, 60 of 100 answered. The outcome rate describes a defined result within its stated denominator: 36 of 100 enrolled reported use. Mixing them turns 36 of 60 into a “60% success” that the evidence does not support, and treats the 40 unknowns as if they had answered.
Does meeting a logframe target prove impact?
No. Meeting a target shows a defined result happened among the people counted. It does not rule out other explanations, such as a strong local job market in Example 1. Attributing change to the program needs a comparison chosen in advance, such as earlier cohorts or an outside figure on the same definition, and an account of who did not respond.
Can local programs or partners use different collection forms?
Yes, as long as they report the shared indicators on the agreed definitions. Partners can keep their own forms and extra questions; what must match is how each shared number is counted. Example 1 shows the cost of a mismatch: Partner C's own placement window kept its 55 out of the portfolio total until it confirmed the 90-day count.
