


Why is a data dictionary important for portfolio reporting?
It defines what each field means, its unit, reporting period and scope. Without that agreement, similar labels can produce misleading totals.


Portfolio Intelligence Tools · BUYER’S GUIDE
Portfolio intelligence tools help teams examine information across grantees, investees or programs. Useful portfolio analysis needs comparable definitions and the underlying narrative evidence—not just a combined view of metrics.
For grantee and program portfolios, compare connected collection with analytics and grant-administration options. Sopact fits evidence aggregation across supported forms, reports and transcripts. Power BI or Tableau may remain useful analytics layers; this is not a comparison of securities or fund-accounting systems.
✳ DECISION INTELLIGENCE FOR PROGRAMS & PORTFOLIOS
Sopact is an AI-native data collection platform. It connects forms, supported files, interview transcripts, feedback and history so teams can investigate change and decide where to act.
Portfolio decisions need more than metric totals. Connect partner updates with supported reports, transcripts and relevant history, using shared definitions without stripping away local context.
START HERE
These options occupy different parts of the workflow. Power BI and Tableau are analytics layers; Fluxx is grant administration; UpMetrics and Sopact address different collection and reporting needs. Spreadsheets are an operating approach, not a software vendor. They are not six interchangeable replacements.
| Option | Consider it for | Tradeoff to understand | Explore |
|---|---|---|---|
| SopactAI-native data collection | Recurring program and portfolio evidence | Needs an internal data owner and configured relationships; specialist operational functions must be checked separately. | Review ↗ |
| Power BI | Analysis of modeled portfolio data | An analytics layer, not a replacement for collection. Inputs, relationships and definitions still need owners. | Review ↗ |
| Tableau | Visual exploration and governed analytics | An analytics layer with lineage; collection and evidence preparation remain separate responsibilities. | Review ↗ |
| Fluxx Grantmaker | Grantmaking and grantee reporting | Grant administration and portfolio evidence overlap, but neither establishes the other’s full workflow. | Review ↗ |
| UpMetrics | Impact collection, analysis and reporting | Optional professional and managed services can handle reporting work; agree which recurring tasks remain internal. | Review ↗ |
| Controlled spreadsheets | A small, bounded reporting process | Flexible and familiar; recurring matching, definitions and version control remain team-managed work. | Review ↗ |
NARROW THE CHOICE
Power BI and Tableau fit maintained analytical models; Fluxx belongs in grantmaking evaluation; UpMetrics addresses impact collection and reporting. Sopact is worth evaluating when the harder job is recurring collection and connecting entity-level evidence before aggregation.
✳ DECISION INTELLIGENCE FOR PROGRAMS & PORTFOLIOS
AI-native data collection.
Better decisions.
Sopact’s AI-native collection approach connects configured forms, supported files and written evidence around programs and portfolios. Agree a data dictionary for entities, periods, units and outcome definitions, then use the connected evidence to investigate what changed and what qualifies the result.
Documented foundations: contact setup , form relationships and supported evidence .
Explore this workflow ↗Use authorized diligence material, reports and interview transcripts in supported formats.
Identify each entity, period, unit and reporting scope; flag incompatible measures.
Reconcile comparable totals and retain the source explanation for material exceptions.
Self-service configuration is not exclusive to Sopact. Compare the full recurring workflow. After setup, can your authorized data owner change a question, connect the next collection stage and check the resulting analysis? Verify the workflow with your team’s permissions. Initial design, training and complex integrations still need an owner.
See how contact fields are configured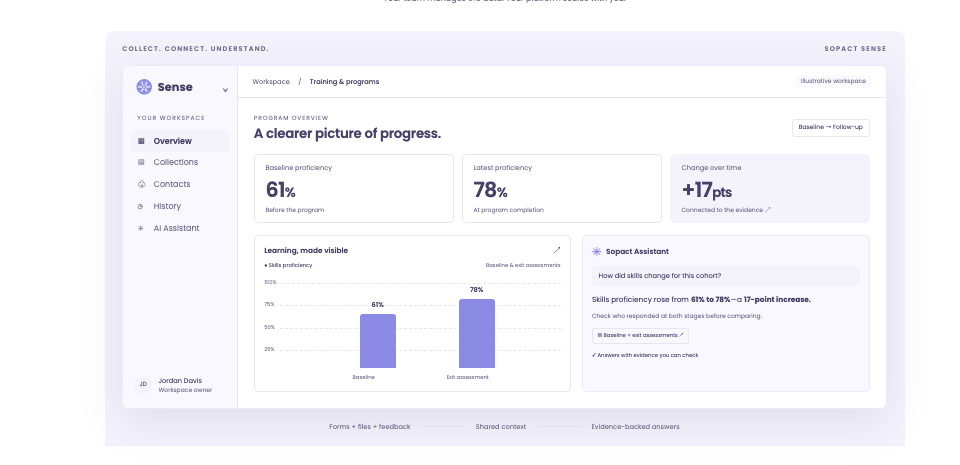
DIRECT COMPARISON
| Decision | What other options offer | Where to evaluate Sopact |
|---|---|---|
| Analytical exploration | Power BI drillthrough and Tableau lineage provide genuine analytical and governance capabilities. | Sopact’s distinction to evaluate is collecting and connecting the evidence that feeds the answer. |
| Software and services | UpMetrics combines an impact platform with available professional services and capacity building. | Compare the recurring tasks an internal Sopact owner can perform; do not infer that every UpMetrics customer requires ongoing advisory services. |
| Aggregation validity | BI tools can aggregate the model they receive. | Resolve conflicting units and reporting scopes before combining results. |
| Narrative qualifications | Diligence and partner reports may qualify a numeric result. | Bring supported narrative evidence into the same portfolio question. |
| Reporting coverage | An incomplete quarter is not necessarily a poor result. | Disclose missing periods, amended submissions and the population represented by the total. |
Claims are bounded to the documented features. Sources and practical limitations are linked in the reviews below. No hands-on parity test is claimed.
THE OTHER OPTIONS
A shorter shortlist is useful only if it keeps the functions you rely on.
Why consider it: Drillthrough takes readers from a summary to a filtered detail page.
Check before choosing: Define how collection, narratives and source records reach the maintained data model.
Read the vendor’s documentationWhy consider it: Tableau Catalog lineage shows data dependencies when the required configuration is enabled.
Check before choosing: Data lineage is not automatically a grantee-level evidence trail. Collection and modeling still need owners.
Read the vendor’s documentationWhy consider it: Supports the grant lifecycle, including applications, reviews, payments and reporting.
Check before choosing: Separate grant administration from the collection definitions and portfolio questions you need to answer.
Read the vendor’s documentationWhy consider it: Impact-reporting software with professional services and capacity-building offerings.
Check before choosing: Clarify which tasks your team owns and which services the proposed engagement includes; availability does not prove mandatory dependence.
Read the vendor’s documentationWhy consider it: An operating approach, not a vendor: useful when records and review responsibilities remain manageable.
Check before choosing: Assign version control, access, reconciliation and source-review responsibilities before expanding.
An operating approach, not a product endorsement.
A CLOSER LOOK
This guide concerns grantee and investee evidence: reported outcomes, diligence material, recurring updates and the context behind them. It does not compare securities look-through, trading analytics or fund-accounting systems.
For a program or impact portfolio, define what each organization reports before combining the results. Keep incompatible indicators separate, disclose missing periods and retain the source explanation. If your main requirement is financial holdings analysis, use a specialist evaluation rather than this shortlist.
BEFORE YOU SWITCH
Use an approved sample. Let the person who will own the workflow run this test.
BUYING QUESTIONS
It defines what each field means, its unit, reporting period and scope. Without that agreement, similar labels can produce misleading totals.
Yes. A maintained analytics layer may remain valuable. Clarify where collection, record matching, definitions and source review happen before changing it.
Not by default. Distinguish missing, not applicable and a measured zero, and explain coverage alongside reported totals.
BRING YOUR REAL WORKFLOW
Bring a form, a supporting file and the decision your team needs to make. See how the collection and analysis fit together.
Prepared by Sopact, a vendor included in this guide. Selection follows the workflow each article addresses. Product statements draw on the linked public documentation; recommendations are editorial judgments, not independent testing. Verify the proposed product, configuration, source handling and controls before purchasing.
Sources reviewed October 21, 2026. Documentation can change. Customer accounts are attributed; illustrations are labeled. The guide does not establish guaranteed accuracy, security certification or a universal implementation timeline.