


What is the difference between attribution and contribution?
Attribution asks whether, and often by how much, a program caused an observed change, which means estimating what would have happened without it. Contribution asks what part the program played alongside other influences, and tests that explanation against evidence. Neither means “sole cause”, and neither is a softer word for success.
Suppose more graduates find jobs after a training program. That rise is an observed outcome; it does not say how much came from the training, a stronger job market, people’s own effort or a job center.
The word has a second meaning. In social return on investment (SROI) and other dollar valuations, “attribution” is an adjustment: the share of an outcome you take out because others helped cause it.
THE SHORT VERSION
- Attribution needs a credible estimate of what would have happened without the program, and a before-and-after change does not provide one.
- Contribution analysis tests each link of your theory of change and the rival explanations, then says which parts the evidence supports.
- In a dollar value, deadweight and attribution are stated assumptions that change the result, so show each one beside the figure.
How do attribution and contribution compare?
They answer different questions with different evidence, and a strong evaluation can use both: one estimates the size of an effect, the other explains how it came about and why it varied.
| Question | Attribution | Contribution |
|---|---|---|
| What it asks | Did the program cause the change, and how much? | What part did the program play among other causes? |
| What it needs | A comparison showing what would have happened otherwise | A stated pathway, delivery records, outcome evidence and rival explanations |
| Typical designs | Random assignment, matched comparison groups, threshold rules, time series | Contribution analysis, process tracing, other theory-based approaches |
| What it produces | An estimated effect, with its uncertainty | A supported, qualified explanation |
| Does before-and-after settle it? | No | No |
The Magenta Book’s analytical-methods guidance describes these approaches for public programs. Choose by the question, not by which word sounds stronger.
Which causal question are you being asked?
Write down the question the funder or board is actually asking before you pick a method, because four common questions need four different kinds of evidence.
| Question asked | What it needs | Who can usually answer |
|---|---|---|
| “Did outcomes change?” | Clear definitions, timing, coverage, the same people measured over time | Program team |
| “How did the program help?” | The pathway, what was delivered, rival explanations | Program team, with a reviewer |
| “How much difference did it make?” | A counterfactual design, planned before collection | An evaluator |
| “Why did results differ by site?” | Delivery, participant and context differences, compared | Program team and evaluator |
Match the strength of your claim to the work you can do, and agree it with the funder early. The UK guidance on quality in impact evaluation stresses proportionate design.
The third question, how much difference the program made, is settled by design rather than by analysis afterwards. The video below compares following the same people over time with comparing groups at one point, and asks which one a funder will accept as evidence of cause.
What does this look like for a workforce program?
Take a fictional regional workforce fund with four job-training partners: the partners report job placements, and the board asks whether the fund’s money produced them. The honest answer depends on which question the board means.
The fund’s agreement counts “placed in a job” within 90 days of exit. Partners A, B and D placed 42, 31 and 27 people, 100 in total. Partner C reported 55 on a six-month window, so the fund holds that number until C confirms a 90-day count.
What the records establish
One hundred people were placed within 90 days of exit, under one agreed definition. That is an outcome count. It says nothing about how many would have found work anyway, or who will still hold the job at 12 months.
What a contribution investigation adds
The fund’s theory of change runs from training and mentoring to certification, placement within 90 days, retention at 12 months and living-wage jobs. A contribution investigation checks each link: did people complete training, earn the certificate, meet employers through the program, and what other help did they have?
It also hears from graduates who did not find work and checks the local job market. If the evidence holds, the report can say what role the program appears to have played.
What an attribution estimate would need
To say how many of the 100 placements training caused, the fund needs a credible estimate of how many would have happened anyway, from random allocation, a waiting list or a matched comparison group planned before enrollment. Until then, the records support an outcome count and a contribution investigation, not a number of placements “caused”.
How do you build a contribution claim that can be challenged?
Contribution analysis tests a proposed explanation of change against evidence and rival causes; it is not the phrase “contributed to” placed in front of a success story. BetterEvaluation’s contribution-analysis guidance describes the approach. These six steps fit a delivery team.
- State the claim precisely. Name outcome, people, place and period: “placement within 90 days of exit for this year’s graduates of Partners A, B and D”.
- Write the pathway and its assumptions. Use your theory of change and write one assumption under each arrow, such as “local employers accept the certificate”.
- Check what was delivered. Record attendance, completion and differences between partners.
- Examine the outcome evidence. Check definitions, time windows, missing records and whether the timing makes sense.
- Investigate alternatives. List other services, job-market shifts and personal circumstances that could explain the result, and look for evidence on each.
- Qualify the explanation. Look for evidence that could weaken it, write down what is unresolved, and decide what to collect next.
The most useful next source is often one you overlooked. If the claim rests on employer introductions, a record of who hired whom tells you more than another workshop rating.
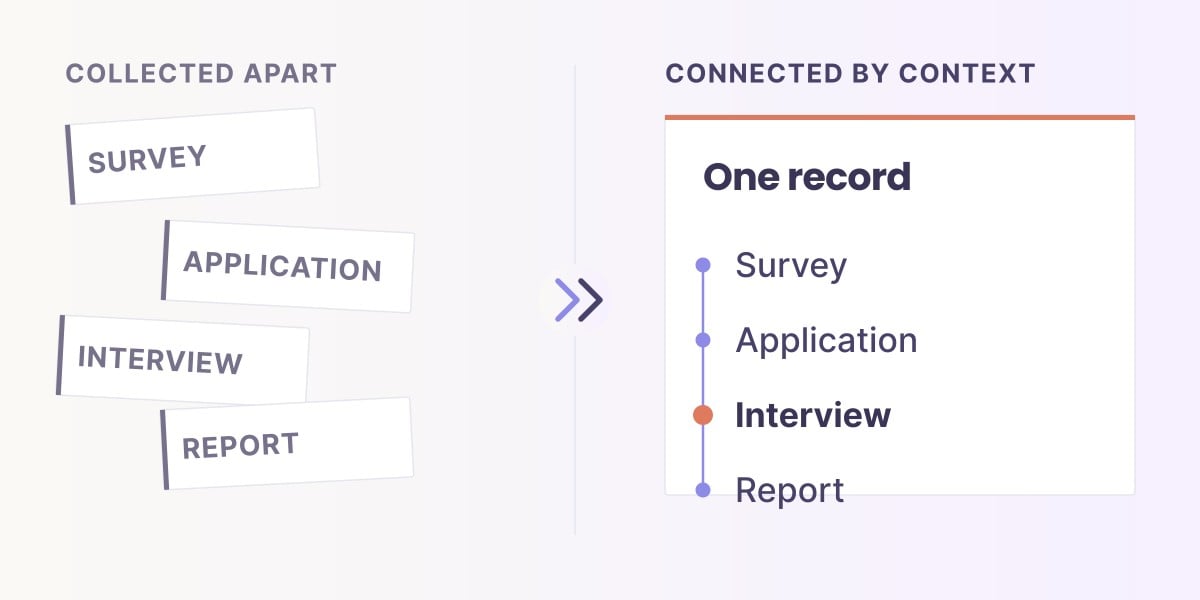
This depends on following the same people over time. In Sopact Sense, a persistent unique ID from the first form keeps intake, completion, placement and 12-month follow-up on one record per person, and each AI Assistant answer links to the records behind it. That makes evidence easier to inspect; it does not make a design causal.
The video below explains the pathway a theory of change lays out, the chain a contribution claim tests. Watch the step from outputs to outcomes, where most rival explanations enter.
How do deadweight and attribution change a dollar value?
In an SROI or other dollar valuation, deadweight takes out what would have happened anyway and attribution takes out the share others caused; each is an assumption that moves the result, so show it beside the figure. Here attribution is an estimate, not a causal finding.
The course’s teaching chain shows it. Ten outcome units valued at 1,000 each give 10,000; 20% deadweight leaves 8,000; 25% attribution leaves 6,000. With 10% drop-off in years two and three and a 5% discount rate, the present value is 14,810.50 against inputs of 10,000, a ratio of 1.48:1.
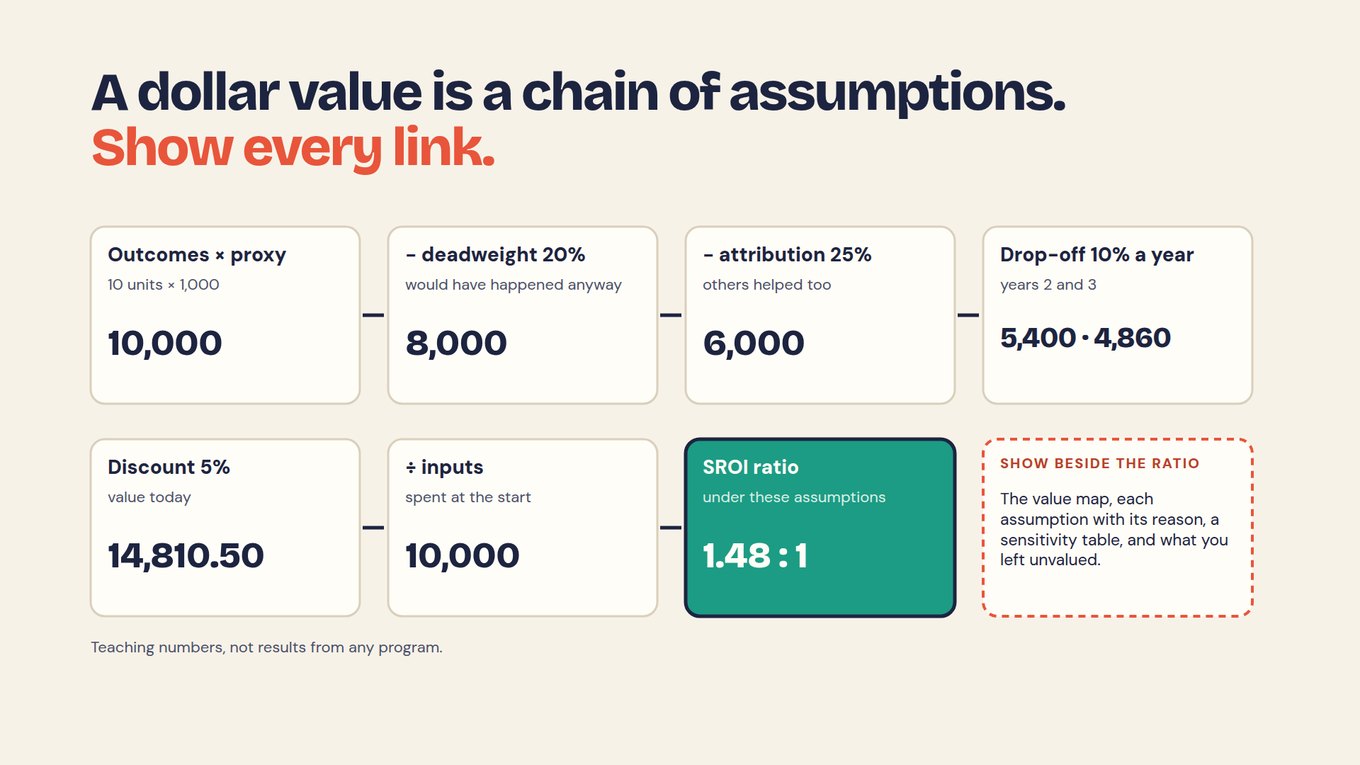
Change one link and the ratio moves. On the same teaching numbers, 50% attribution instead of 25% gives about 0.99:1 (our arithmetic), and the course shows 40% deadweight giving 1.11:1.
For the workforce fund, earnings stay “not yet valued” until partners collect wage before enrollment, hours worked and 12-month retention. The chapter A credible dollar value for your results shows when to report outcomes without a dollar figure.
Can outside data stand in for a counterfactual?
Only partly: a comparison on the same definition gives context for your result, but it does not show what your participants would have done without the program.
Two comparisons are usually within reach. Earlier cohorts show whether results moved after a program change, though not whether the change caused the movement. An outside figure, such as the Bureau of Labor Statistics wage for the job a track trains for, shows where graduates’ starting wages sit against the local range for the same occupation, area and year.
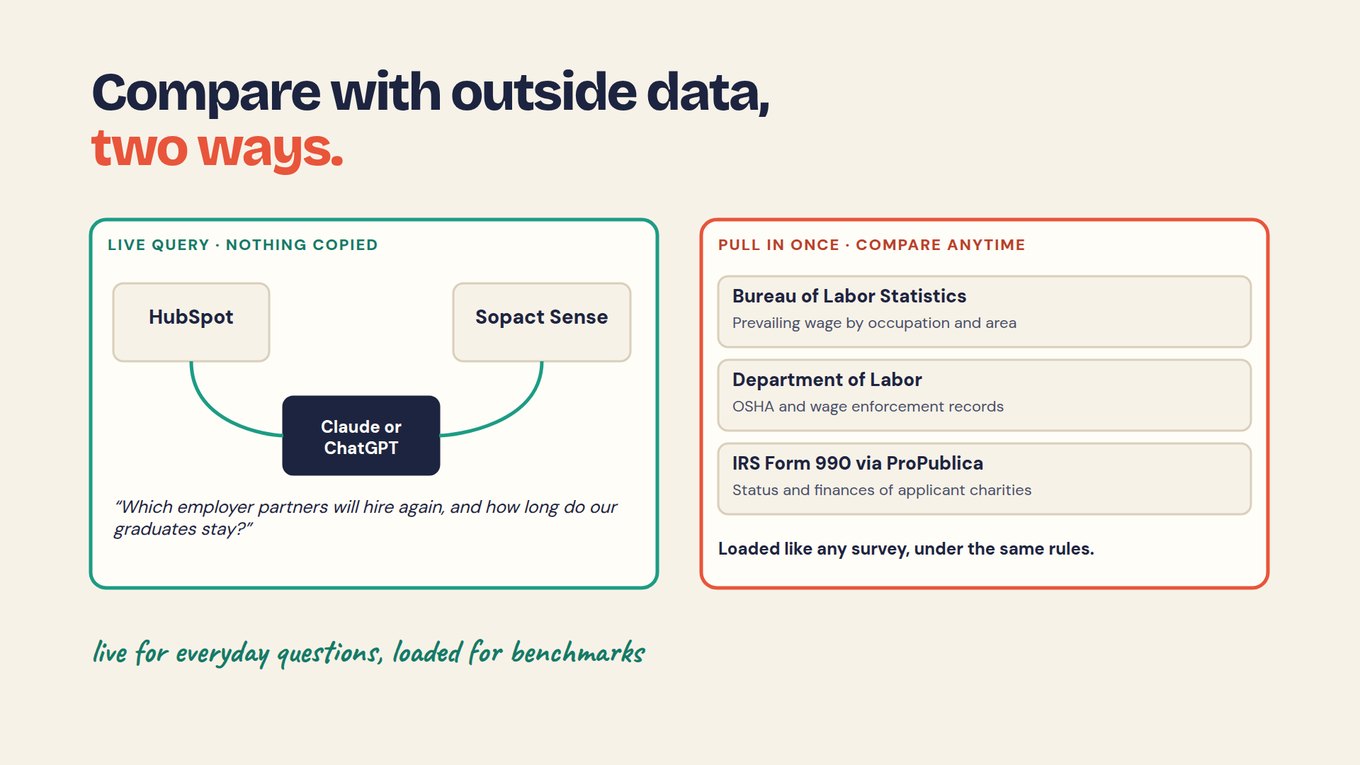
Match definitions first. BLS occupation wages cover all workers in a job, not new hires, so compare new graduates with the 25th percentile as well as the median. Partner C’s single average starting wage cannot enter the comparison, because the agreement asks for wage by track.
If graduates earn above the local 25th percentile, report it and say what it does not show: people who enroll may differ from the typical local worker. The chapter Compare your results with outside data covers sources and how to keep names out.
How should you word the claim in a report?
Write the observed result, your interpretation and the limit as three separate sentences, so a reader can see where the evidence stops. Never report a share of credit that no method produced.
THREE SENTENCES · FICTIONAL WORKFORCE FUND
Observed: 100 people across Partners A, B and D were placed in a job within 90 days of exit; Partner C’s 55 are held until its 90-day count is confirmed.
Interpretation: Graduates name employer introductions and mentoring as the main help, and we are checking this against hiring records and local job-market changes.
Limit: These counts do not show how many placements the program caused.
If an evaluation later estimates an effect, name its design and uncertainty. The impact report template covers the rest.
PROMPT · PASTE INTO CLAUDE, CHATGPT OR YOUR AI TOOL
I will paste our outcome counts with definitions, our theory of change and notes on other influences. No names.
1. Label each statement in our draft: observed result, interpretation, or causal claim.
2. For each causal claim, say whether our evidence supports attribution, contribution, or neither, and why.
3. List rival explanations we have not examined.
4. Rewrite the summary as three sentences: what we observed, what we think it means, what it does not show.
5. Use only numbers in our data. Do not invent figures, percentages or shares of credit. If something is missing, write "not in our data".
What can neither approach prove?
Neither approach turns thin evidence into proof: a contribution story built from selected quotes is not analysis, and an attribution estimate is only as good as its comparison group. Keep outputs and outcomes apart too; sessions delivered are outputs, while 100 people placed is an outcome count.
Self-reported answers carry recall and courtesy bias, and people who stop responding may differ from those who stay. AI can sort evidence and draft wording but cannot supply a missing counterfactual; check its lines against the records, and let a named person decide the claim.
Start with one claim this reporting cycle
Pick one outcome claim you already make and test it before your next report goes out.
- Copy the sentence from your last report that implies the program caused something.
- Mark which of the four questions it answers.
- Write the pathway behind it, with one assumption under each arrow.
- List three rival explanations and one record that would test each.
- Check the outcome definition against your agreement, including the window, such as 90 days after exit.
- Rewrite the claim as observed result, interpretation and limit.
After the first cycle you have one claim a reviewer can challenge, its evidence, and a list of what to collect next, such as 12-month retention.
Frequently asked questions
Does attribution mean claiming all the credit?
No. Attribution means estimating the part of a change the program caused, and that estimate can sit alongside many other influences. “The program was the sole cause” is a much stronger claim, and it is not what attribution means. A credible finding names its comparison, assumptions and uncertainty.
Is contribution analysis less work than attribution?
Not necessarily. It avoids the need for a comparison group, but a credible contribution claim still means stating the pathway, checking what was delivered, examining outcome evidence and testing rival explanations. In a complex setting with incomplete records, that can take as much work as a quantitative study.
Does attribution always require a randomized controlled trial?
No. Random assignment is one way to build a credible counterfactual. Others include matched comparison groups, a threshold rule such as an eligibility score, and time series with a clear break. Each rests on assumptions, and some are not feasible or ethical for a given program. Choose with an evaluator before collection starts.
Can participant stories establish causation?
On their own, no. Stories show experience and can reveal how a program worked. They can also be incomplete, shaped by recall or by wanting to please staff. Weigh them with delivery records, outcome data and rival explanations, and include people with poor outcomes, not only the success stories.
What does attribution mean in SROI?
In SROI, attribution is an adjustment: the share of an outcome you take out because other organizations or people helped cause it. In the course’s teaching chain, a 25% attribution takes 8,000 down to 6,000 after deadweight. It is an estimate you state and justify, not a causal finding, and a sensitivity table should show how the ratio moves if it is wrong.
