


What is a logic model?
A logic model is a one-page chain showing how a program's inputs and activities are expected to produce outputs, then outcomes for people, then a long-term impact, so a team and its funders can agree what will be done and what should change. It describes the intended path; it does not show that the results happened.
Most read left to right in five columns. Some split outcomes into short-, medium- and long-term or drop the impact column; follow your funder's layout and keep delivery and change apart.
THE SHORT VERSION
- A logic model has five parts, inputs, activities, outputs, outcomes and impact, with the assumptions that link them written underneath.
- Build it backward from the change you expect, and keep what you deliver (outputs) apart from what changes for people (outcomes).
- Give each output and outcome one indicator with a plain definition, and the model becomes the reporting agreement your funder checks.
What are the five components of a logic model?
The five components are inputs, activities, outputs, outcomes and impact: what you have, what you do, what you deliver, what changes for people and the long-term change you are aiming at. Each answers one question, shown here for a fictional job-training program.
| Component | Question it answers | Workforce example |
|---|---|---|
| Inputs | What resources do we have? | Trainers, mentors, employer contacts, funding |
| Activities | What do we do? | Training sessions and mentoring |
| Outputs | What do we deliver, and to whom? | Participants enrolled; completed training |
| Outcomes | What changes for people? | Placed in a job within 90 days; retained at 12 months |
| Impact | What long-term change do we support? | Graduates in living-wage jobs |
Assumptions belong under the arrows even without a column: what must be true for the next step to follow. CDC's logic model example splits outcomes by time horizon.
The short video below walks through practical uses of a logic model in planning and evaluation. Watch for the point where delivery counts stop and changes for people begin, because that is the line most models blur.
What does a completed logic model look like?
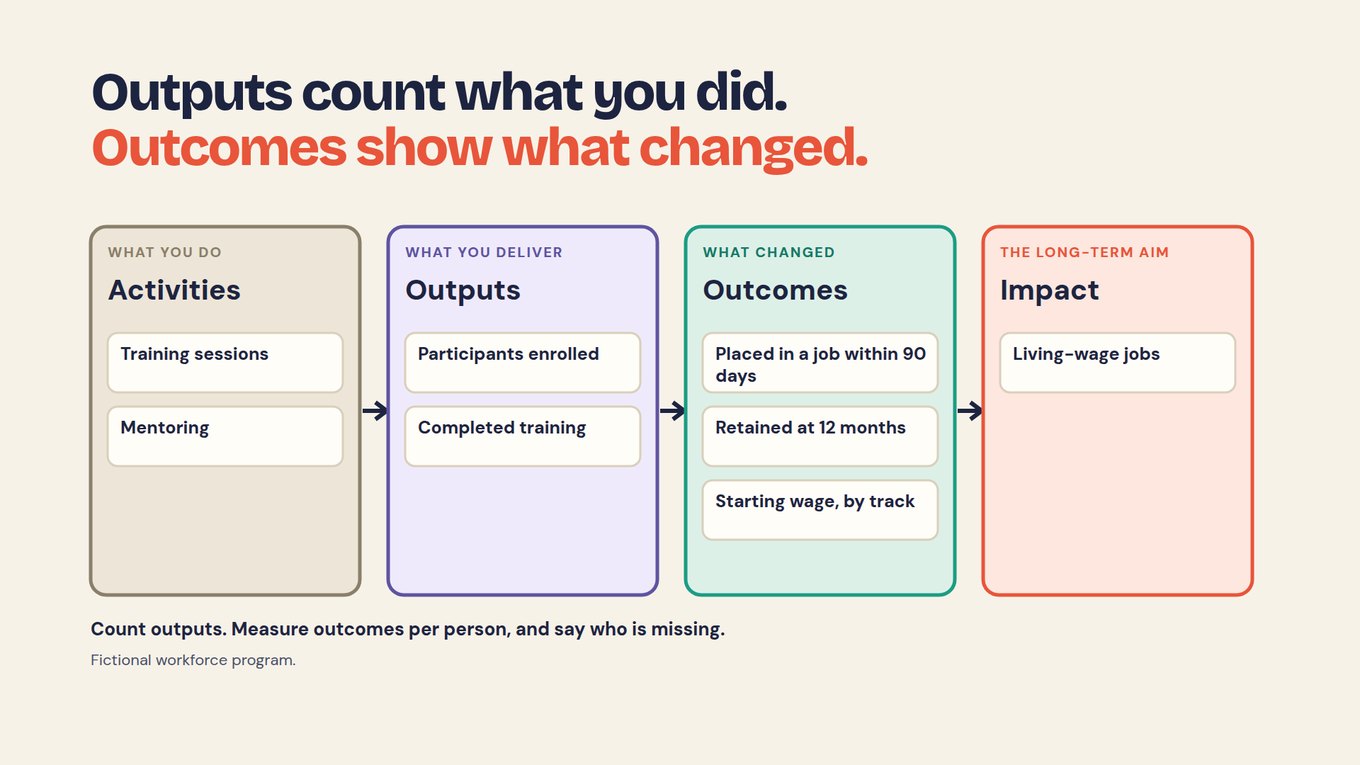
A completed logic model fits on one page: one row that runs from resources to long-term change, with an assumption written under each arrow. This one comes from the course's fictional regional workforce fund, which funds four job-training partners, A to D. It is one partner's model, as drafted after the fund's onboarding call.
| Inputs | Activities | Outputs | Outcomes | Impact |
|---|---|---|---|---|
| Trainers, mentors, employer contacts | Training sessions; mentoring | Participants enrolled (unique people); completed training | Placed in a job within 90 days of exit; retained in the same job at 12 months; starting wage, by track | Graduates in living-wage jobs |
Read the arrows as claims: the training matches what local employers hire for, employers recognize the certification, and the first job fits well enough to keep. If graduates finish but no suitable jobs are within reach, more training will not close that gap.
The slide shows the same line: enrolled and completed count what the partner did, while placement, retention and wage are measured per person, with non-responders reported as missing.
How do you build a logic model, step by step?
Start from the long-term change and the people who would experience it, work backward to the outcomes that lead there, then add activities, outputs and inputs, and write an assumption under each arrow. Starting from your favorite activity produces a list of tasks, not a model.
- Name the change and who experiences it. "Graduates in living-wage jobs" is a change; "run a training program" is not.
- Work back to the earlier outcomes. Retention at 12 months needs a placement within 90 days, which needs completed training.
- Add activities and outputs. List what you do and the counts it produces, each with a unit: unique people, not sessions.
- List inputs and check feasibility. Trainers, mentors and employer contacts must exist for every cohort you plan.
- Write the assumptions. Mark the one that would change your plan if it were wrong.
- Test it with the people affected. Graduates may value a steady schedule as much as the wage.
Then read the draft both ways. Forward: if we do this, why would that follow? Backward: for this outcome, what else must be true? Remove any arrow that expresses hope without a reason.
A funder can draft the model with the partner instead of sending a blank form. AHA Ventures, the investment arm of the American Heart Association, is growing its portfolio from 19 to more than 40 companies. Its head of impact drafts each company's logic model and data dictionary during the onboarding call, from the call itself, with Sopact Sense.
The chapter Turn the onboarding call into a reporting agreement shows the method. With any AI tool, this prompt gives you a first draft to check line by line.
PROMPT · PASTE INTO CLAUDE, CHATGPT OR YOUR AI TOOL
Below are notes or a call transcript about our program. Draft a logic model from them.

Rules:
1. Use only what the text says. Do not invent activities, outcomes, targets or numbers.
2. Give five columns: inputs, activities, outputs, outcomes, impact. Counts of what we deliver go in outputs; changes for people go in outcomes.
3. Under each arrow, write the assumption that must hold for the next column to follow.
4. For each output and outcome, suggest one indicator with a plain definition: who is counted, what qualifies, by when. Where the text is silent, write "not in our data".
5. End with the three questions we must answer before we share the model with a funder.

Our notes or transcript:
[PASTE]
How do you add indicators to a logic model?
Keep the diagram readable and put indicators in a companion table: one indicator per output and outcome, each with a plain definition, a due date and a source. Those rows are what the funder and the partner sign as the reporting agreement.
| Indicator | Level | Plain definition · due | Source |
|---|---|---|---|
| Participants enrolled | Output | Unique people, not visits · quarterly | Enrollment form |
| Completed training | Output | Finished the track · quarterly | Completion record |
| Placed in a job | Outcome | Job within 90 days of exit · quarterly | Placement survey |
| Retained | Outcome | Same job at 12 months · annual | 12-month follow-up |
| Starting wage | Outcome | Hourly, by track · annual | Placement survey |
Before several partners can count a row the same way, it also needs who qualifies, how missing answers are treated and who owns the rule: a data dictionary entry, as in the chapter A shared data dictionary.
If an indicator has no level in the model, ask why you collect it; if a level has no indicator, it is an untested assumption.
What are the most common logic model mistakes?
Most weak logic models make one of five mistakes: they call delivery an outcome, skip the middle steps, ignore outside conditions, treat arrows as proof or cram every detail into the diagram. Each has a plain fix.
| Mistake | What it looks like | Fix |
|---|---|---|
| Calling delivery an outcome | "People trained" in the outcomes column | Move it to outputs; name the change training should bring |
| Skipping the middle | Training, then living-wage jobs, nothing between | Add placement within 90 days and retention at 12 months |
| Ignoring outside conditions | No mention of local hiring or transport | Write them as assumptions and watch them |
| Arrows as proof | "Training leads to jobs" stated as fact | Treat each arrow as a question reports will answer |
| Overloaded diagram | Definitions and targets in every box | Move them to the companion indicator table |
The video below looks at the costliest of these mistakes: a model that goes into a folder after grant approval and is never tested or updated. Watch for what the model needs beside it to stay in use.
How do you use a logic model once the program is running?
Use it as the checklist for every review: place each reported number at its level and look for the point where the chain breaks. Where it breaks tells you what to investigate.
If enrollment is low, look at access and scheduling. If people enroll but few complete, look at content and support. If they complete but are not placed within 90 days, test the assumption that suitable jobs are within reach before adding more training.
For a funder, the model is also the ruler for each funded partner's report: the fictional fund's Partner C reported placements "within 6 months", so its count waits for the 90-day figure. In Sopact Sense, each participant keeps one ID from the first form, and every line of an answer links to a record you can open.
Keep the limits in view. A model is a claim, not proof: a rise in placements after training does not show the training caused it without a comparison, such as earlier cohorts. Follow-up answers are self-reported and some people never reply, so report the unknowns, check any AI draft against the records, and let people decide what results mean.
Is a logic model the same as a theory of change?
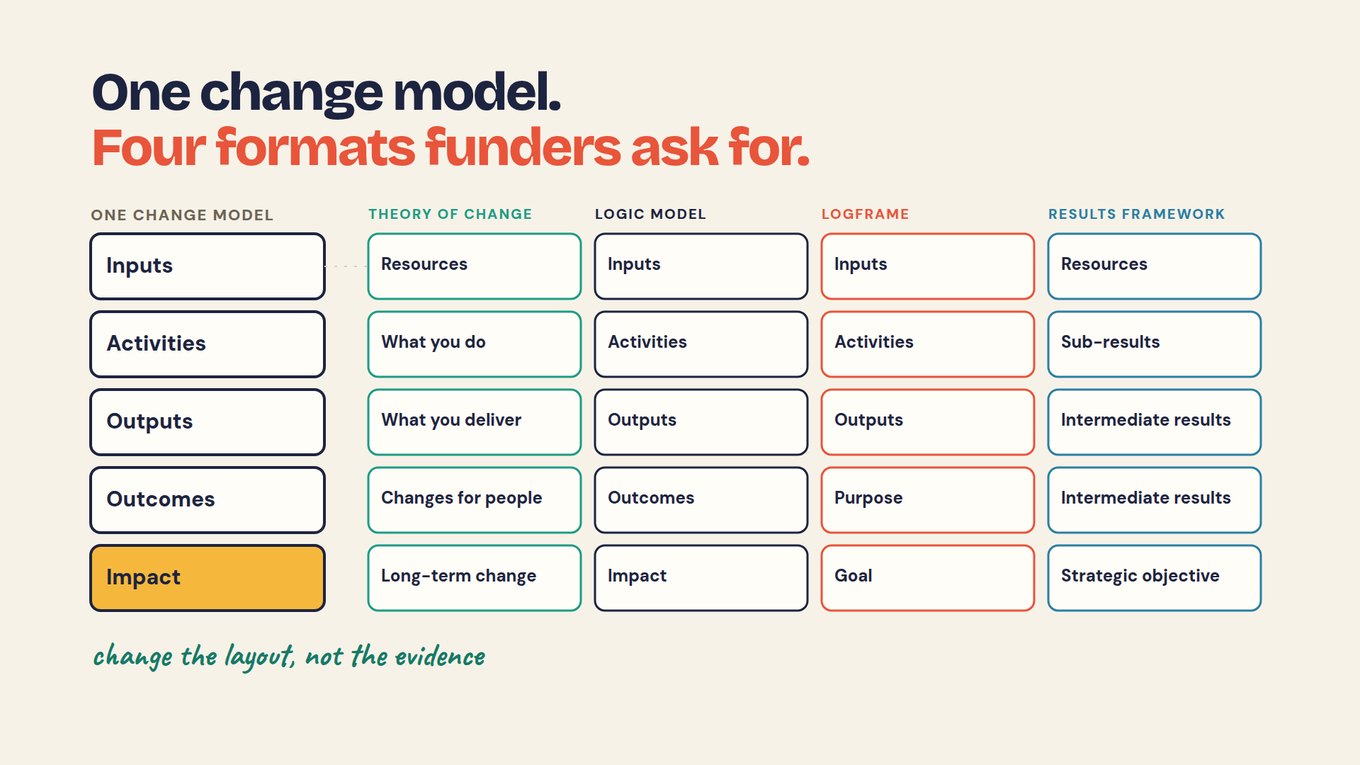
They describe the same chain with different emphasis: a theory of change explains why each step should lead to the next, while a logic model lays out what you deliver and what should change in a compact table. A logframe and a results framework use the same five levels under other labels.
Build one model and re-lay it when a funder asks for another format; indicators, definitions and sources stay the same. The chapter One change model, four formats shows the relabelling.
Related guides: theory of change vs logic model, a copyable logic model template and the funder's view in a results framework.
Start with one program's logic model this month
Pick one program you already run and draft its model on a single page before you build anything larger. The steps below take a small team through one review cycle.
- Write the program's long-term change in one line, naming who experiences it.
- Work back to two or three outcomes, each with a time window, such as "within 90 days of exit".
- Add activities, outputs and inputs, then write one assumption under each arrow.
- Give each output and outcome one indicator, a plain definition and a form you already run as its source.
- Share it with two participants, one staff member and your funder, and note what they change.
- At the next review, mark where the chain held and where it broke.
After the first cycle you have a one-page model, an indicator table your funder can sign and one assumption you know you need to test.
Frequently asked questions
Is there one correct logic model template?
No. Formats range from four to six columns, and some split outcomes into short-, medium- and long-term. What matters is that the model separates delivery from change, names the assumptions and gives each output and outcome an indicator someone else could count. When a funder specifies a layout, use it and keep your content the same.
What is the difference between outputs and outcomes in a logic model?
Outputs count what the program delivered, such as participants enrolled or people who completed training. Outcomes describe what changed for those people, such as being placed in a job within 90 days or still in that job at 12 months. Outputs are largely in your control; outcomes also depend on employers, families and each person's circumstances.
Should impact be a separate column?
It can be. Some formats end with a long-term outcome instead of an impact column. Either works if the final box names a change for people that the program contributes to but does not deliver alone, such as graduates in living-wage jobs. Define your terms on the page rather than adding a column to match a count.
Can a logic model include negative or unintended effects?
Yes, and it should when they are plausible. Write them into the assumptions or beside the outcomes they could affect, and decide how you will watch for them. For a job-training program, a placement that pushes someone into a job they leave within weeks is a risk worth naming, and retention at 12 months is one way to see it.
Does every activity need its own outcome?
No. Several activities can support one outcome, and one activity can support several. Training and mentoring together lead toward placement, for example. Keep the links plausible and readable, and if a diagram needs dozens of arrows, move the detail into notes or the companion indicator table so the model still fits on one page.
