play icon for videos
← Academy
Analyze · Training

How to Measure Behavior Change After Training?

The 60–90 day on-the-job follow-up that shows whether the training actually transferred — run on the same participant ID that already holds their learning score.

<!DOCTYPE html> <html lang="en"> <head> <meta charset="utf-8"> <meta name="viewport" content="width=device-width, initial-scale=1"> <style> @keyframes pd{0%,100%{opacity:1}50%{opacity:.35}} *{box-sizing:border-box} body{margin:0;font-family:'Hanken Grotesk',-apple-system,BlinkMacSystemFont,sans-serif;background:#F7F4EC;padding:24px;display:flex;justify-content:center} .card{width:600px;max-width:100%;background:#FFFFFF;border:1px solid #ECE4D4;border-radius:20px;box-shadow:0 24px 60px -34px rgba(74,52,38,.36),0 2px 4px rgba(74,52,38,.05);overflow:hidden} .hdr{display:flex;align-items:center;gap:11px;padding:16px 20px;border-bottom:1px solid #F1EADD;background:#FBF8F1} .hdr .ic{display:inline-flex;width:30px;height:30px;align-items:center;justify-content:center;border:2px solid #C05B3F;border-radius:50%;color:#C05B3F;font-size:15px;font-weight:800;flex-shrink:0} .hdr .t{min-width:0} .hdr .t .n{font-weight:800;font-size:14.5px;color:#2C2318;letter-spacing:-.2px;line-height:1.25} .hdr .t .s{font-size:12px;color:#8A7B66} .hdr .pill{margin-left:auto;display:inline-flex;align-items:center;gap:6px;font-size:11.5px;font-weight:700;color:#C05B3F;background:#F6E6E0;padding:5px 10px;border-radius:20px;white-space:nowrap} .hdr .pill .d{width:6px;height:6px;border-radius:50%;background:#C05B3F;animation:pd 2s infinite} .tabs{display:flex;gap:0;padding:12px 16px 0;background:#FBF8F1;flex-wrap:wrap} .tab{flex:1;min-width:70px;display:flex;flex-direction:column;align-items:center;gap:5px;cursor:pointer;font-family:inherit;font-size:11.5px;font-weight:700;color:#8A7B66;background:transparent;border:none;border-bottom:2px solid transparent;padding:8px 4px 10px} .tab.on{font-weight:800;color:#C05B3F;border-bottom-color:#C05B3F} .tab .num{display:inline-flex;width:20px;height:20px;align-items:center;justify-content:center;border-radius:50%;font-size:11px;font-weight:800;color:#8A7B66;background:#F1EADD} .tab.on .num{color:#fff;background:#C05B3F} .divider{height:1px;background:#F1EADD} .body{padding:20px} .eyebrow{font-size:10.5px;font-weight:800;letter-spacing:1.2px;text-transform:uppercase;color:#C05B3F;margin-bottom:6px} .headline{font-family:'Inter',Georgia,serif;font-size:18px;font-weight:600;line-height:1.3;color:#2C2318;margin-bottom:14px} .promptlbl{font-size:10px;font-weight:800;letter-spacing:1px;text-transform:uppercase;color:#B3A58E;margin-bottom:7px} .promptbox{position:relative;font-family:ui-monospace,'SF Mono',Menlo,monospace;font-size:11.5px;line-height:1.55;color:#3A3022;background:#F7F4EC;border:1px solid #ECE4D4;border-left:3px solid #C05B3F;border-radius:11px;padding:13px 14px 13px 15px} .promptbox .car{color:#C05B3F;font-weight:800} .copy{display:inline-flex;align-items:center;gap:6px;margin-top:11px;cursor:pointer;font-family:inherit;font-size:11.5px;font-weight:800;color:#8A7B66;background:#F1EADD;border:1px solid #E4D9C4;border-radius:8px;padding:7px 12px} .copy:hover{color:#C05B3F} .copy.done{color:#15884F;border-color:#BBE3C9;background:#EAF6EE} .foot{display:flex;align-items:center;gap:12px;background:#2C2318;border-radius:13px;padding:13px 15px;margin-top:16px} .foot .rt{flex:1;min-width:0} .foot .rt .n{font-size:12.5px;font-weight:800;color:#F7F0E4} .foot .rt .s{font-size:11px;color:#C7B79E} .foot a.go{display:inline-flex;align-items:center;gap:5px;font-size:11.5px;font-weight:800;color:#2C2318;background:#E7A98F;text-decoration:none;padding:8px 14px;border-radius:20px;white-space:nowrap} .foot a.go:hover{background:#F0BEA6} </style> </head> <body> <div class="card"> <div class="hdr"> <span class="ic">&#9670;</span> <div class="t"> <div class="n">How to measure behavior change after training</div> <div class="s">Sopact Sense &middot; copy a prompt, run it on your data</div> </div> <span class="pill"><span class="d"></span>Level 3</span> </div> <div class="tabs" id="tabs"></div> <div class="divider"></div> <div class="body" id="body"></div> </div> <script> (function(){ var TABS = ["Job", "Setup", "Analyze", "Forward"]; var CONTENT = [{"tab": "Job", "what": "Measure whether people apply the trained behavior on the job — the level almost no one reaches.", "prompt": "You are the Sopact Sense Assistant. The job is to measure whether participants actually apply the trained behavior on the job 60–90 days later, following one person on their persistent ID from the training through the follow-up."}, {"tab": "Setup", "what": "Fire a 60–90 day follow-up per participant: self-report behavior scale + manager/peer rating + one open “what got in the way.”", "prompt": "Design a 60–90 day follow-up instrument that fires per participant, combining a self-report behavior scale, a short manager/peer rating, and one open-ended “what got in the way” — all linked to the participant’s original ID and their Level 2 learning score."}, {"tab": "Analyze", "what": "Report application rate, rank transfer barriers, correlate behavior change with the Level 2 gain.", "prompt": "Analyze Level 3 (Behavior) for [COHORT]: from the 60–90 day follow-up, measure whether each participant applies the trained behavior on the job (self-report plus manager rating on the same ID), report the application rate and the top barriers to transfer from the open-ended responses, and correlate behavior change with the Level 2 learning gain."}, {"tab": "Forward", "what": "Correlation, not proof — route unresolved barriers to a named owner, then link to Level 4 results.", "prompt": "Treat behavior change as correlation, not proof of causation. Route each unresolved transfer barrier to a named owner, and prepare the record to connect forward to Level 4 (organizational results)."}]; var phase = 0; var tabsEl = document.getElementById('tabs'); var bodyEl = document.getElementById('body'); function renderTabs(){ tabsEl.innerHTML=''; TABS.forEach(function(label,i){ var b=document.createElement('button'); b.type='button'; b.className='tab'+(i===phase?' on':''); b.innerHTML='<span class="num">'+(i+1)+'</span><span>'+label+'</span>'; b.addEventListener('click',function(){phase=i;render();}); tabsEl.appendChild(b); }); } function renderBody(){ var c=CONTENT[phase]; var out='<div class="eyebrow">Step '+(phase+1)+' &middot; '+c.tab+'</div>'; out+='<div class="headline">'+c.what+'</div>'; out+='<div class="promptlbl">Copy-paste prompt</div>'; out+='<div class="promptbox"><span class="car">&gt; </span><span id="ptxt"></span></div>'; out+='<button type="button" class="copy" id="copyBtn"><span>&#128203;</span><span id="copyLbl">Copy prompt</span></button>'; out+='<div class="foot"><div class="rt"><div class="n">Run it in Sopact Sense</div><div class="s">Clean data + persistent IDs, graded in one pass</div></div><a class="go" href="https://www.sopact.com/request-demo" target="_blank" rel="noopener">Request a demo &rarr;</a></div>'; bodyEl.innerHTML=out; document.getElementById('ptxt').textContent=c.prompt; var btn=document.getElementById('copyBtn'); btn.addEventListener('click',function(){ var txt=c.prompt; function done(){btn.classList.add('done');document.getElementById('copyLbl').textContent='Copied';setTimeout(function(){btn.classList.remove('done');document.getElementById('copyLbl').textContent='Copy prompt';},1600);} if(navigator.clipboard&&navigator.clipboard.writeText){navigator.clipboard.writeText(txt).then(done,function(){fb(txt);done();});}else{fb(txt);done();} }); function fb(t){var ta=document.createElement('textarea');ta.value=t;ta.style.position='fixed';ta.style.opacity='0';document.body.appendChild(ta);ta.select();try{document.execCommand('copy');}catch(e){}document.body.removeChild(ta);} } function render(){renderTabs();renderBody();} render(); })(); </script> </body> </html>
Sopact Academy · Course review

Academy / Training & programs / Deep dive

Practical Academy guide

How to Measure Behavior Change After Training?

To measure behavior change after training, define the action people should use in their work, collect appropriate evidence when they have an opportunity to use it, and distinguish reported application from observed application. Keep the dates, source and relevant starting evidence so you can assess change without confusing missing follow-up with failure.

Additional course links
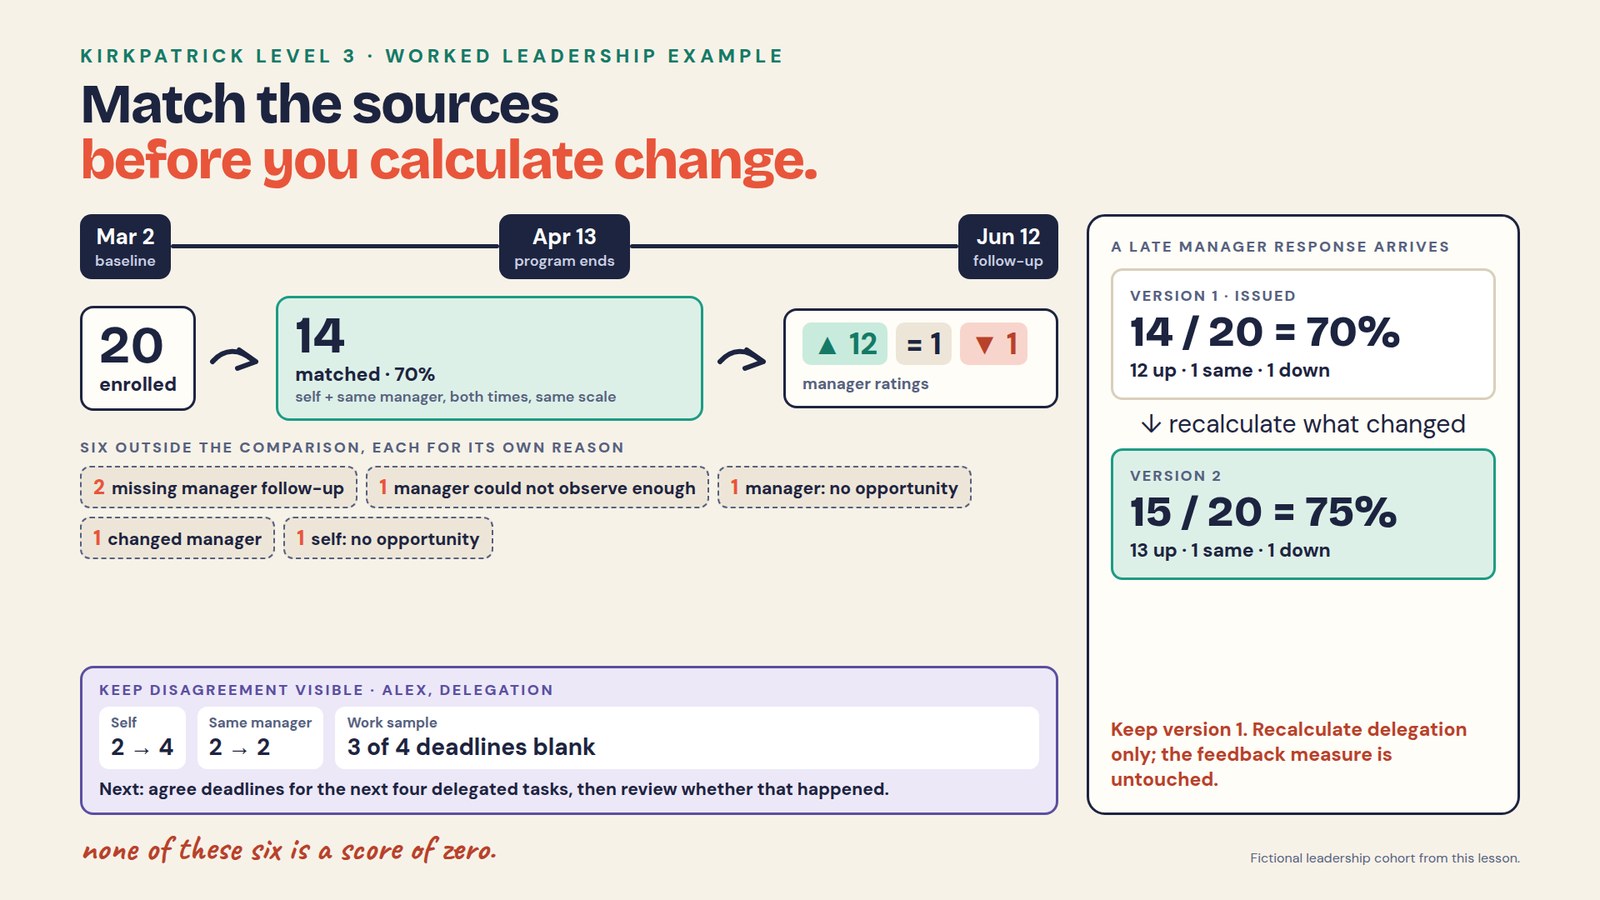
Measure behavior change after training, Kirkpatrick Level 3 worked leadership example: baseline March 2, program ends April 13, follow-up June 12. 20 enrolled; 14 matched with self and same-manager ratings at both times on the same scale (70%); manager ratings 12 up, 1 unchanged, 1 down. Six outside the comparison: 2 missing manager follow-ups, 1 manager could not observe enough, 1 manager reported no opportunity, 1 changed manager, 1 self-report of no opportunity. Alex, delegation: self 2 to 4, same manager 2 to 2, work sample with 3 of 4 deadlines blank. A late manager response changes version 1 (14 of 20, 70%) to version 2 (15 of 20, 75%, 13 up, 1 same, 1 down).
At a glance: the worked leadership example in this lesson. Match the sources first, keep each exclusion visible, then recalculate only what a late response changes. Fictional cohort.

In the Kirkpatrick Model, Level 3 concerns critical behaviors in the performance environment, including the support that enables people to carry them out. It is not simply a survey sent on a fixed day after a course. See Kirkpatrick Partners’ explanation of the model.

Define the behavior in observable terms

“Communicates better” leaves too much room for interpretation. A fictional service program might instead ask whether a handoff includes the next action, the responsible team and the expected response date. A reviewer can look for those elements without deciding whether someone is generally a good communicator.

Define what counts as application and what does not. Keep the unit clear: a person, a handoff or an observation period may each support a different question. Decide whether you are assessing one successful attempt, repeated use or an improvement relative to a starting point.

Plan support and observation together

People need a realistic opportunity to use the behavior. The timing of follow-up should reflect that opportunity and the decision the team needs to make. A rare annual task calls for a different plan from a task used every shift.

Kirkpatrick Partners emphasizes early monitoring and support rather than waiting until 90 days to begin examining application. Plan check-ins around actual work so the team can respond while the information is useful. Source: the official Level 3 description.

For the service example, the team might review an early sample of handoffs, ask what made the method difficult and revisit the evidence after a practical adjustment. This is a hypothetical collection plan, not a universal schedule.

Choose evidence and keep perspectives distinct

SourceWhat it can contributeLimit to retain
Learner accountWhen the learner says they used the method and what happenedA self-report is not the same as direct observation
Work sampleWhether specified elements appear in a handoffThe sample may not represent all work
Manager or peer observationAnother perspective on a defined actionThe observer may not see every opportunity and may apply criteria differently
Operational recordDates or events relevant to useA recorded event may not establish the quality of the behavior

Use the sources suited to the task. A manager rating is not mandatory in every design and is not automatically more accurate than a learner’s account. Record whose evidence it is and review disagreements rather than averaging them into apparent agreement.

Connect the record without changing the privacy promise

Where identified follow-up is appropriate, link observations to the continuing learner record, course episode and relevant dates. Reuse stable registration information rather than asking the person to re-enter it. Keep the observer role and measure version with each observation.

Anonymous feedback can still help explain group-level barriers, but it cannot support a claimed individual learning-to-application history. Choose the design deliberately and explain its limits. Do not retrospectively identify respondents because matching would be convenient.

In Sopact, a continuing record can keep task evidence, learner comments and later observations together where permitted. The data dictionary gives reviewers shared criteria. The collection and review configuration still needs to be tested; a stored identifier does not establish that a measure is valid or that training caused a change.

Calculate an application rate with the right base

Suppose 40 people completed a course. At the review date, 30 are known to have had an opportunity to perform the task. Twenty of those 30 have usable follow-up evidence, and 14 of the 20 meet the agreed application criterion.

The observed application rate among those with usable evidence is 14/20, or 70%. Follow-up coverage among those known to have an opportunity is 20/30, or about 67%. Show both. Do not describe the missing ten observations as non-application, and do not present 70% as a measured result for all 40 completers.

If the opportunity status of other learners is unknown, show that too. If some were not expected to use the task yet, retain that distinction. The reporting base should follow the question and the evidence, not whichever denominator produces the most favorable result.

Investigate barriers to use

Ask what made application difficult. Possible explanations include unclear guidance, no opportunity, unavailable tools, conflicting priorities or uncertainty about the method. Treat them as reported barriers until the relevant evidence or review supports more.

Code comments with definitions and keep the source passages. One person can report several barriers. Frequency does not establish severity, and a lack of comments does not establish that no barriers exist.

Assign an owner to the response. A request for a job aid, approval of the request, delivery of the aid and later use are separate observations. Keep that chain visible so reporting does not mistake an assigned action for a resolved problem.

Read learning and application together

A linked record lets you examine whether people with particular learning evidence later demonstrate the target behavior. First confirm that the starting and later measures mean what you say they mean. A confidence increase is not automatically a learning gain, and an unobserved behavior is not automatically a failure to transfer.

For a descriptive comparison, report the matched group and its coverage. Differences in opportunity, task assignment, support and observation can influence what you see. Do not describe association as proof that training caused the application or that a learner’s lack of application was caused by the course.

Worked leadership example: match sources before calculating change

This separate fictional leadership cohort illustrates a paired comparison. It uses different data and a different measure from the application-rate example above. Twenty leaders have a baseline on March 2, a program ending April 13 and follow-up on June 12. Sixty days after the program is an illustrative schedule, chosen here for the work opportunities; it is not a universal requirement.

  1. Define the comparison in advance. For each behavior, require numeric self and manager ratings at both time points, the same manager, and the same question version and 1–5 scale. This strict common sample lets the reviewer examine the two perspectives for the same people. Other designs can use different rules if clearly stated.
  2. Match by stable IDs. Use participant, employer client, cohort, observer and behavior IDs. A name alone is not a reliable join. Keep the observation period and source with every value.
  3. Check exclusions before calculating. Missing response, not observed, no opportunity and changed manager remain distinct states. None is a score of zero.
  4. Calculate each source separately. Subtract the baseline from follow-up for that same source and behavior. Describe a positive difference as an increased rating, not automatically a meaningful improvement.
ResultCount
Enrolled cohort20
Meets all four-rating requirements14 (70% of the cohort)
Manager rating increased12 of the 14
Manager rating unchanged1 of the 14
Manager rating decreased1 of the 14

The six exclusions are two missing manager follow-ups, one manager unable to observe enough, one manager reporting no opportunity, one changed manager and one self-report of no opportunity. These categories are mutually exclusive in this example. For overlapping real-world states, define a counting rule.

Keep disagreement visible in the coach’s review

For fictional participant Alex, the self-rating for delegation rises from 2 to 4 while the same manager’s rating remains 2. A permitted work sample shows named owners and expected outputs, but three of four deadlines are blank. The reviewer can investigate deadline-setting without concluding that Alex made no progress or that the manager is correct about every aspect of delegation.

A possible next action is to agree deadlines for the next four delegated tasks and review whether that practice was used. An assigned action is not evidence that it happened. Keep private coaching interpretation out of the employer report unless the sharing arrangement permits it.

Recalculate only what a late response changes

Suppose one missing, valid manager delegation response arrives after the report cutoff. It completes a previously excluded leader’s four-rating set. Matched coverage becomes 15/20 = 75%; the new manager result is 13 increased, one unchanged and one decreased. Preserve the issued 14-person report and explain the changed evidence and denominator in version 2.

The late response contains only delegation evidence. It does not change the separate feedback-behavior sample, which has 15 matched leaders in this dataset. Never apply one behavior’s completion count to every measure.

View the completed client report (PDF). Use the leadership questionnaire to design your own items. Its 12 individual behaviors are a separate practical template; the aggregate delegation and feedback measures in this fictional example are not validation results for that questionnaire.

Your exercise

  1. Define one observable behavior and the criterion for application.
  2. Choose when people are likely to have a real opportunity to use it.
  3. Select appropriate sources and record their limitations.
  4. Define the eligible group, usable follow-up and missing states.
  5. Calculate a hypothetical rate and show coverage separately.
  6. Assign an owner to investigate a reported barrier.
  7. Describe the next observation that would tell you whether the response helped.

Frequently asked questions

What is Kirkpatrick Level 3?

It examines critical behavior in the performance environment and the support around it. Use the official model guidance when applying the framework; the practical example here illustrates a collection and review plan.

When should behavior follow-up happen?

Plan it around meaningful opportunities to use the behavior and the need for timely support. Do not treat a fixed 60–90-day interval as a requirement for every program.

Does a manager rating confirm behavior change?

It supplies another observation or judgment. Its usefulness depends on what the manager saw, the criteria used and the context. Preserve differences between sources and inspect the evidence before concluding that change occurred.

Return to your course →

Put this guide into practice.

Start with a decision your team needs to make. Decide what information belongs together, how you will check it, and who is responsible for acting.

See context in action →
Prepare Data Governance Before Using AI
Prepare your data governance
nonprofit-data-governance-before-ai
Feedback
Foundation
Prepare an evidence register and a tested governance baseline before applying AI to program data.
How to Turn Findings into Action and Check What Changes
The Loop — the method in one read
the-loop
Loop
The method
0
One continuous method for reliable, traceable AI reporting across case, application, grant, and program workflows: collect clean, analyze on arrival, and improve in time.
For growing data collection, connected analysis and recurring reporting
What Is Case Intelligence?
what-is-case-intelligence
Case
Foundation
1
One current, traceable record for each person—connecting intake, services, notes, surveys, documents, outcomes, decisions, and follow-up.
Workforce and training · Youth and mentoring · Case management · Scholarships · Accelerators · Education · Nonprofit programs
What is grant intelligence?
What Is Grant Intelligence?
what-is-grant-intelligence
Grant
Foundation
1
One connected evidence record from application and committee review through the awarded grant, grantee reporting, renewal, and board accountability.
Foundations and grantmakers · Public grant programs · Scholarships and fellowships · Accelerators
Connected Data Intelligence
Understand the approach
connected-data-intelligence
Feedback
Foundation
1
Connect recurring collection, relevant history, AI analysis, and governance in a workflow your team can maintain.
Growing organizations managing recurring data collection without a dedicated data team.
Measurement and Reporting: From Agreement to Evidence-Based Report
Measurement and reporting: from agreement to report
embedded-impact-measurement
Reporting
Start here
1
Turn the onboarding call into a reporting agreement, share one data dictionary, and write reports funders can compare and check.
For funders and the organizations they fund
Connect company context before collecting another return
Connect context
track-investees-impact-agreement-variance
Portfolio
Portfolio intelligence tools
1
Build a repeatable collect, review and improve cycle
Methodology — continuous, not annual
loop-methodology
Loop
The method
1
The continuous collect–analyze–improve cycle, adopted as an experiment: start with the step that already pays and add one data-collection step at a time.
Teams tired of rebuilding spreadsheets and forms who want a measurement system that compounds instead of resetting.
Agree the theory of change and core metrics on the onboarding call
Agree measures
onboard-portfolio-lock-impact-agreement-track-results
Portfolio
Portfolio intelligence tools
2
Test whether an AI-assisted result is repeatable and correct
Reliability — test repeatability and accuracy
loop-reliability
Loop
The method
2
Test repeatability and accuracy using versioned data, defined calculations, known-answer checks and human review of qualitative interpretation.
Teams that need to check recurring AI-assisted analysis before using it in decisions or reports.
Design an application process around the decision, not the form
Design an Application Process
how-to-design-an-application-process
Grant
Foundation
2
How to Structure Stakeholder Data: Four Common Patterns
Choose your record structure
which-shape-is-your-data
Feedback
Foundation
2
Map the people, observations and relationships your workflow needs before collecting data.
Turn the onboarding call into a reporting agreement
onboarding-call-to-reporting-agreement
Reporting
Agree together
2
How to build a theory of change, then show it as a logic model, logframe or results framework
how-to-build-a-theory-of-change
Reporting
Agree together
3
How to Build a Logic Model: Steps, Example and AI Prompt
Build a Logic Model You Can Use
how-to-build-a-logic-model
Reporting
Align
3
How do you onboard a grant or RFP program?
Onboard a Grant or RFP Program
how-to-onboard-a-grant-rfp-program
Grant
Foundation
3
Turn your theory of change into a data-collection plan
Turn a Theory of Change into a Data-Collection Workflow
theory-of-change-to-data-collection-workflow
Case
Foundation
3
Run quarterly collection around each company's dictionary
Collect quarterly
collect-investee-reporting-without-burden
Portfolio
Portfolio intelligence tools
3
Keep a clear trail from a finding to its evidence
Traceability & Transparency
loop-traceability
Loop
The method
3
Every figure links back to the exact response, note, or document it came from — a full audit trail from headline result to raw evidence.
Teams whose numbers get scrutinized — by funders, boards, auditors, or standards — and who need to answer where did this come from on the spot.
Build Context: What Your AI Needs to Know
Build context
build-organization-evidence-model
Feedback
Foundation
3
How to Change Survey Questions Without Losing Comparability
Change questions with a clear history
change-questions-without-breaking-the-record
Feedback
Control
3
Create a question-change log and decide how old and new versions should appear in reports.
Programme & MEL leads · Teams whose questionnaire has ossified · Anyone evaluating a platform where configuration is a purchased service
Five Dimensions of Impact: How to Review Your Evidence
Use the Five Dimensions to Test the Evidence
five-dimensions-of-impact
Reporting
Align
4
How do you design a grant rubric and eligibility rules?
Design Your Rubric & Eligibility Rules
grant-rubric-eligibility-rules
Grant
Foundation
4
Review impact and financial evidence before it reaches the dashboard
Review and approve
read-investee-reports-multi-signal
Portfolio
Portfolio intelligence tools
4
Adapt the learning cycle to your workflow
Flexibility — one method, four workflows
loop-flexibility
Loop
The method
4
The same collect–analyze–improve cycle, shaped to four kinds of impact work — case, grant, portfolio, and feedback — each shown end to end.
Anyone deciding where the Loop fits their work, who wants to see the full path from messy input to a report they can defend.
How to Collect Feedback Offline and Track the Same People Over Time
Collect offline and reconcile the batch
collect-feedback-offline
Feedback
Connect
4
Build a field protocol and reconcile a test batch across devices, visits and delayed uploads.
Field & multi-site programs · Low-connectivity contexts · Teams collecting in person
How Do You Design an Intake Form for a Baseline?
Design an Intake Form That Captures a Usable Baseline
intake-form-usable-baseline
Case
Nonprofit Track
5
Turn a proposed outcome into a reporting definition
Outcomes vs Outputs
frame-outcomes-over-outputs
Grant
Foundation
5
Plan and review your first workflow pilot
loop-guarantee
Loop
The method
5
How to Analyze Documents as Evidence: Sources, Context and Review
Read documents as traceable evidence
read-documents-as-evidence
Feedback
Connect
5
Create a document register and reviewed findings with source locations, context and explicit exceptions.
Check each partner report against the agreement
check-partner-reports-against-agreement
Reporting
Funder road
5
Combine compatible metrics and explain every portfolio total
Build rollups
portfolio-impact-rollups
Portfolio
Portfolio intelligence tools
5
How to Clean Open-Ended Survey Responses Without Losing Meaning
Clean responses and define the denominator
clean-open-ended-survey-responses
Feedback
Clean
6
Create a cleaning log, response-status table and reproducible report statement.
How to Review Participant Support Needs Mid-Program
Spot At-Risk Participants Mid-Program
spot-at-risk-participants-mid-program
Case
Nonprofit Track
6
How to Write a Nonprofit Grant Application: Template and Example
Grant Application for Nonprofits
grant-application-for-nonprofit-organizations
Grant
Foundation
6
Personalize quarterly donor and annual LP reports
Report with evidence
portfolio-lp-board-impact-report
Portfolio
Portfolio intelligence tools
6
How to Build a Funder Context Profile: Research to Reporting
Build a Sourced Funder Context Profile
build-funder-context-profile
Reporting
Align
6
Roll up and benchmark portfolio results
roll-up-and-benchmark-portfolio-results
Reporting
Funder road
6
How Do You Measure Change at Exit?
Measure Change at Exit (Not Just Completion)
measure-change-at-exit
Case
Nonprofit Track
7
How do you collect applications clean at the source?
Collect Applications Clean at the Source
collect-applications-clean-at-source
Grant
Collect
7
Turn portfolio findings into action and test the next cycle
Act and improve
portfolio-risk-monitoring-alerts
Portfolio
Portfolio intelligence tools
7
How to Analyze Multilingual Feedback Without Losing Meaning
Analyze and review multilingual feedback
analyze-multilingual-feedback
Feedback
Clean
7
Build a language review sheet and test software on original responses, translations, codes and reporting bases.
Multi-country programs · Multilingual survey data · Global networks & chapters
How to Define Impact Metrics Your Team and Funder Can Use
Define Measures the Organization and Funder Can Both Use
define-impact-metrics-funders-want
Reporting
Align
7
Write the portfolio report for your board or donors
write-the-portfolio-report
Reporting
Funder road
7
Survey Attrition: How to Track Missing Waves in Longitudinal Studies
Track missing waves and matched outcomes
survey-attrition-longitudinal-studies
Feedback
Read
8
Build a wave-status register, compare response groups and report paired change with coverage and limitations.
How to Use Mentor Notes to Review Participant Support
Use mentor notes for support review
mentor-notes-early-warning
Case
Nonprofit Track
8
How do you reduce applicant burden?
Reduce Applicant Burden
reduce-applicant-burden-auto-clarification
Grant
Collect
8
Impact Metric Definitions: A Practical Worksheet and Example
Give Every Number One Definition
one-definition-for-every-number
Reporting
Define
8
Map every funder's ask to one evidence base
turn-reporting-requirements-into-evidence
Reporting
Funded partner road
8
How to Connect Quantitative and Qualitative Survey Data
Connect scores and comments
connect-quantitative-qualitative-survey-data
Feedback
Read
9
Build a linked analysis view and joint display, with clear groups, reporting bases and evidence limits.
How to Calculate SROI as New Evidence Arrives
Calculate SROI — Live, Sourced, and Honest
calculate-sroi-live
Case
Nonprofit Track
9
How to Collect Grantee Reports with Less Burden
Collect Grantee Reports Without Burden
collect-grantee-reporting-without-burden
Grant
Collect
9
Capture each funder's taste, and your own
capture-funder-taste
Reporting
Funded partner road
9
How to Analyze Pre, Mid and Post Survey Data
Analyze pre, mid and post surveys
analyze-pre-mid-post-survey-data
Feedback
Read
10
Build a matched pre/mid/post analysis, interpret score movement and retain clear rules for missing waves.
How to Report a Job-Training Program to Grant Funders
Turn a Cohort into a Funder Impact Report
job-training-grant-impact-report
Case
Nonprofit Track
10
How to Follow Up on Missing Grantee Data
Chase Missing Grantee Data
chase-missing-grantee-data
Grant
Collect
10
How to Collect Clean Data Inside Your Workflow
Collect Clean Evidence Inside the Workflow
collect-clean-data-at-the-source
Reporting
Embed
10
Write each funder's report with AI, then check it
assistant-writes-the-funder-report
Reporting
Funded partner road
10
Draft from approved sources, check the claims, and save an accountable report version. Bring the brief from the previous lesson.
Program managers, grant leads and reporting teams
How to Analyze Longitudinal Survey Data
Analyze longitudinal survey data
analyze-longitudinal-survey-data
Feedback
Read
11
Build a continuing analysis record with clear time scales, observed trajectories and limits.
How to Turn a Job Description into a Requirements Checklist
Clarify employer requirements
job-description-requirements-checklist
Case
Social Enterprise Track
11
Review applications without reviewer bias: one rubric, read on arrival, people decide
Review Without Reviewer Bias
review-applications-without-reviewer-bias
Grant
Analyze
11
How to Keep Impact Reporting Numbers Consistent
Get Stable Results From Governed Data
same-numbers-every-time
Reporting
Read
11
Compare your results with outside data: live queries and public datasets
compare-with-outside-data
Reporting
Toolkit
11
How do you analyze a batch of grant applications?
Analyze a Whole Round
how-to-analyze-a-batch-of-grant-applications
Grant
Analyze
12
How to Measure Outcome Duration and Drop-Off
Measure outcome duration and drop-off
measure-outcome-duration-drop-off
Feedback
Read
12
Build a dated outcome claim, distinguish missingness from outcome loss and test forecast assumptions.
How to Score Candidate–Role Matches with a Clear Rubric
Review candidate–role evidence
score-candidate-role-matches-without-bias
Case
Social Enterprise Track
12
Make every number in your report match its source
where-every-number-came-from
Reporting
Toolkit
12
How to Report Job Placements to Impact Investors
Turn a Cohort into a Social-Enterprise Investor Report
job-placement-investor-impact-report
Case
Social Enterprise Track
13
How do you track reviewer conflicts of interest?
Track Reviewer Conflicts of Interest
track-conflicts-of-interest-audit
Grant
Analyze
13
How to Write a Donor Report: Format, Evidence and Example
Design a Report for a Real Funding Decision
donor-report-funders-trust
Reporting
Decide
13
Build a report brief and claim-and-evidence table before drafting. Explain delivery, outcomes, spending, limitations and next actions.
Program managers, grant leads and reporting teams
How to put a credible dollar value on your results
credible-dollar-value-on-impact
Reporting
Toolkit
13
Prepare a valuation brief. Decide what the evidence supports, what needs more work, and when an outcome account is enough.
Program, evaluation and investment teams considering social-value estimates
AI Data Access Controls: What Your Assistant May See
Control what the assistant can access
what-the-assistant-may-see
Feedback
Prove
13
Define task-specific access, test synthetic records and verify report-sharing boundaries.
How to calculate the SROI ratio, step by step: value map, financial proxies and adjustments
how-to-calculate-the-sroi-ratio
Reporting
Toolkit
14
Build a reproducible SROI calculation, test its assumptions and explain the result in a reviewed report.
Evaluation and reporting teams reviewing an SROI calculation
How to Write an Evidence-Based Impact Narrative for a Funder Report
Write a cited impact narrative
impact-narrative-funder-report-cited
Feedback
Prove
14
Build and check a report paragraph using a claim-and-source table, appropriate quotations and clear limitations.
How Do You Read a Grantee Report?
Read a Grantee Report
read-grantee-report-multi-signal
Grant
Analyze
14
How Do You Compute Grantee Variance?
Compute Grantee Variance
how-to-compute-grantee-variance
Grant
Analyze
15
Keep a person’s history connected across programs and staff changes
Follow one person over time
one-person-followed-for-years
Feedback
Shapes
15
Build a participant record that preserves episodes, dates, versions and missingness across repeated collection.
How Do You Build an SROI Value Map?
Build an SROI Value Map
how-to-build-an-sroi-value-map
Reporting
Optional method
16
Build a first value map, keep missing evidence visible, and give each unresolved outcome a next action.
Evaluation, program and investment teams preparing an SROI analysis
How do you track budget, invoices and actual spend for a grant?
Track Budget vs Actual Spend
how-to-track-budget-invoices-actual-spend
Grant
Analyze
16
Multi-Rater Feedback: Connect Perspectives and Protect Context
Connect several perspectives on one person
several-people-describing-one-person
Feedback
Shapes
16
Design subject-rater relationships, reporting rules and a tested multi-perspective feedback record.
How Do You Pick a Financial Proxy for SROI?
Pick a Defensible Financial Proxy
how-to-pick-a-financial-proxy-for-sroi
Reporting
Optional method
17
Compare candidate valuation sources and document why one fits your outcome, stakeholder and reporting period.
Evaluation and reporting teams selecting financial proxies
How Do You Analyze Grantee Reporting Longitudinally?
Analyze Grantee Reporting Over Time
analyze-grantee-reporting-longitudinal
Grant
Analyze
17
Cross-Program Reporting: Combine Results Without Losing Meaning
Combine evidence across programs
many-programs-one-picture
Feedback
Shapes
17
Build a defensible cross-program result with comparable measures, correct denominators and documented exclusions.
How to read Form 990 for a grant review
Read a 990 for Compliance
how-to-read-a-990-for-compliance
Grant
Analyze
18
Pick One Question. Keep Every System You Have.
Run a member-network survey
member-network-survey
Feedback
Shapes
18
Design and test a member reporting cycle with continuing records, coverage checks and authorized results.
Ask your whole grant round anything (Assistant + MCP)
Ask Your Whole Grant Round Anything
ask-your-grant-round-anything
Grant
Analyze
19
How do you build a grant audit trail?
Build a Grant Audit Trail
grant-audit-compliance-trail
Grant
Communicate
20
How do you produce grant compliance and regulatory reports?
Produce Compliance Reports
grant-compliance-regulatory-reports
Grant
Communicate
21
How Do You Roll Grantees Into a Board Report?
Roll Grantees Into a Board Report
roll-grantees-funder-board-report
Grant
Communicate
22
How Do You Build Grant Dashboards and Maps?
Grant Dashboards & Maps
grant-dashboards-geographic-mapping
Grant
Communicate
23