

Sopact is a technology based social enterprise committed to helping organizations measure impact by directly involving their stakeholders.
Useful links
Copyright 2015-2025 © sopact. All rights reserved.


New webinar on 3rd March 2026 | 9:00 am PT
In this webinar, discover how Sopact Sense revolutionizes data collection and analysis.
Learn how to measure customer satisfaction with AI-powered analysis connecting scores to stories and extracting drivers from open-ended feedback.
Most organizations measure customer satisfaction scores they can't explain — tracking numbers that rise and fall without knowing why or what to fix.
Measuring customer satisfaction means building feedback systems that capture both the score and the story behind it — connecting what customers rate with why they rated it that way, all in real time.
The ritual is familiar across every industry: send CSAT surveys quarterly, calculate average scores, watch NPS trend up or down, present the results to leadership. When scores drop, teams scramble to understand what went wrong. When they improve, no one can pinpoint what actually worked.
The metrics exist — clean, numerical, ready for dashboards — while the insights that drive improvement sit buried in hundreds of unanalyzed open-ended responses. Teams collect satisfaction data religiously but rarely understand the drivers behind it.
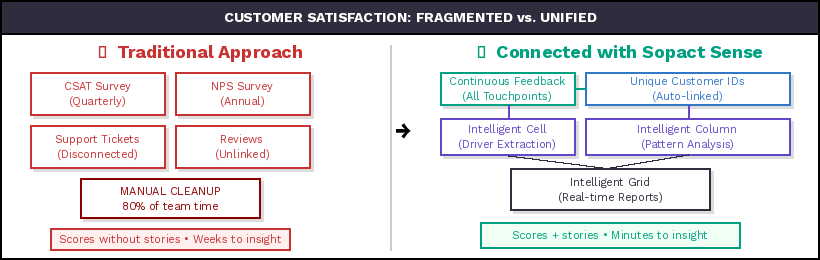
This gap isn't a data problem. It's an architecture problem. Traditional satisfaction measurement separates quantitative scores from qualitative context, fragments customer feedback across disconnected surveys, and delivers insights weeks after the moments that matter.
Effective satisfaction measurement requires systems where ratings automatically connect to the narratives explaining them, feedback flows continuously through natural customer touchpoints rather than disrupting with quarterly surveys, and AI extracts the patterns from qualitative responses that manual analysis never reaches at scale.
By the end of this article, you'll learn:
📌 HERO VIDEO PLACEMENTEmbed YouTube video here: https://www.youtube.com/watch?v=pXHuBzE3-BQ&list=PLUZhQX79v60VKfnFppQ2ew4SmlKJ61B9b&index=1&t=7s
Let's start by examining why most satisfaction measurement produces numbers without narratives — and why that architectural gap prevents the improvements teams need most.
Traditional satisfaction measurement produces metrics you can track but insights you can't act on. The scores exist — clean, numerical, dashboard-ready — while the understanding that drives improvement remains buried in unanalyzed feedback.
CSAT scores tell you customers are dissatisfied. They don't tell you why. NPS reveals how many would recommend you. It doesn't explain what experiences drive those recommendations or what would convert detractors. When satisfaction drops from 7.8 to 7.2, no one knows which touchpoints failed, what customer segments drove the decline, or which specific experiences need fixing.
The explanations exist — buried in "Additional comments" fields that most teams never systematically analyze. Customers explain exactly why they're dissatisfied, which features matter most, what would improve their experience. But processing 500 open-ended responses takes weeks of manual coding that satisfaction measurement cycles don't accommodate.
Teams present average scores and track trends while the richest satisfaction data goes unused because traditional tools can't process qualitative context at scale.
Quarterly satisfaction surveys describe how customers felt three months ago. By the time insights arrive, those customers have already adapted, switched providers, or forgotten what prompted their original rating. The measurement feels comprehensive but the timing makes it useless for responsive improvement.
This lag doesn't just delay action — it fundamentally limits what satisfaction measurement can achieve. You're always looking backward, analyzing historical sentiment, trying to fix problems that may have already resolved or evolved.
Real satisfaction improvement requires understanding how customers feel now and what's changing in real time, not what happened last quarter.
Most satisfaction measurement treats survey responses as the end goal rather than a leading indicator of behavior that actually matters: retention, repeat purchase, referrals, lifetime value. Teams track satisfaction scores religiously without validating whether those scores predict the outcomes they claim to measure.
Does a customer rating satisfaction as 8/10 actually stay longer than one rating 6/10? Do NPS promoters generate more referrals? Does CSAT correlate with retention in your specific business? Most organizations don't know because their satisfaction data lives disconnected from behavioral data — different systems, different timelines, no shared customer ID to link them.
Without connecting satisfaction to behavior, teams optimize metrics that may not predict the business outcomes they're trying to improve.
Customer satisfaction measurement is the systematic process of collecting, analyzing, and acting on feedback that reveals how well your products, services, and experiences meet customer expectations. Effective measurement connects quantitative scores (CSAT, NPS, CES) with qualitative context (the reasons behind those scores) to produce insights that drive improvement rather than just tracking trends.
The most widely used customer satisfaction metrics each capture a different dimension of the customer experience:
Customer Satisfaction Score (CSAT) measures immediate satisfaction with a specific interaction or experience, typically on a 1-5 scale. It answers "How satisfied were you with this experience?" and works best at individual touchpoints — post-purchase, post-support, post-onboarding.
Net Promoter Score (NPS) quantifies customer loyalty by asking how likely customers are to recommend you on a 0-10 scale. Respondents become Promoters (9-10), Passives (7-8), or Detractors (0-6). NPS captures relationship-level sentiment rather than transactional satisfaction.
Customer Effort Score (CES) evaluates how easy it was for customers to accomplish what they needed. Low-effort experiences correlate strongly with loyalty — customers who struggle to get help or complete tasks are far more likely to churn regardless of their satisfaction with the outcome.
Customer Retention Rate and Customer Lifetime Value (CLV) are behavioral metrics that validate whether satisfaction scores actually predict the outcomes organizations care about most.
The critical insight: none of these metrics alone tells you what to fix. A CSAT score of 3.2 is useful for tracking — useless for improving. Only when connected to qualitative context ("why did you rate us 3?") do satisfaction metrics become actionable.
The problems above aren't failures of effort — they're failures of architecture. Traditional satisfaction measurement was designed for a world where qualitative analysis required human coders, data lived in spreadsheets, and quarterly cycles matched the pace of business. That world no longer exists.
Three architectural failures create the gap between measurement and improvement:
Fragmented data collection — satisfaction feedback arrives through different tools (survey platforms, support tickets, review sites, social channels) with no shared customer identity. Merging these sources requires manual work that most teams don't have capacity for, so each channel produces isolated insights that never combine into a complete picture.
Qualitative analysis bottleneck — open-ended responses contain the richest satisfaction intelligence, but traditional tools can't process them at scale. Manual coding takes weeks, covers only a sample, and introduces analyst bias. Organizations collect qualitative data they can't use, so they default to quantitative scores that track trends without explaining them.
Static reporting cycles — satisfaction insights arrive as periodic reports that describe the past rather than inform the present. By the time findings reach decision-makers, the window for responsive action has closed. This creates a pattern where measurement documents problems rather than preventing them.
How connected satisfaction measurement transforms what teams can achieve
A subscription software company wants to understand why satisfaction dropped 8 points last quarter. The process is familiar but frustrating.
Wait for quarterly survey to close, then export disconnected data files (scores in one CSV, comments in another). Manually match satisfaction ratings to open-ended responses, spending days trying to find patterns in 600+ comments. Present findings 6 weeks after survey closed: "Satisfaction declined, themes include support and features" with hand-picked quotes. By the time insights reach stakeholders, customers who were dissatisfied have already churned or forgotten what prompted their ratings.
The team produces metrics without understanding, insights that arrive too late, and no connection between satisfaction scores and actual customer behavior like retention or expansion.
The same company implements connected satisfaction measurement with Sopact Sense. The difference is architectural, not incremental.
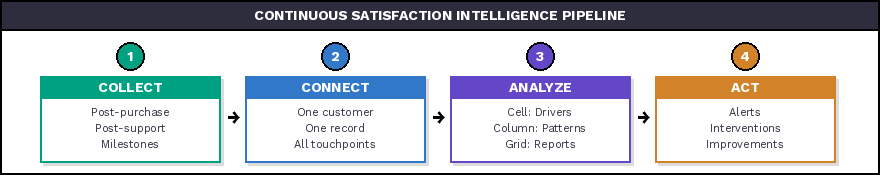
Collect satisfaction feedback continuously at natural touchpoints (post-purchase, post-support, milestones) with unique customer IDs linking everything automatically. Intelligent Cell extracts satisfaction drivers from open-ended responses in real time: 47% cite support response time, 32% mention feature gaps, 21% note onboarding friction. Intelligent Column reveals support issues spike 60 days before renewal among customers who churn — enabling proactive intervention while there's time to act. Intelligent Grid generates comprehensive satisfaction intelligence instantly, updating continuously as new feedback arrives rather than waiting for quarterly cycles.
The team understands not just that satisfaction dropped, but why (specific driver patterns), when (60-day early warning), and who (at-risk customer segments) — with insights available immediately instead of weeks later. More importantly, satisfaction data connects to retention behavior, validating which drivers actually predict churn.
The difference is night and day: from lagging indicators to leading intelligence, from quarterly snapshots to continuous learning, from metrics you track to insights you act on.
Three foundations make connected measurement work:
Every customer gets a persistent unique identifier from first contact. Every satisfaction touchpoint — post-purchase survey, support interaction feedback, renewal check-in, NPS pulse — references this same ID automatically. No duplicate records. No manual matching. No fragmented profiles across disconnected survey tools.
This sounds simple but changes everything downstream. When a customer rates support satisfaction as 2/5 and writes "waited 45 minutes for response," that data point automatically connects to their NPS history, their purchase behavior, their support ticket volume, and their renewal timeline. The architecture creates connections that manual processes can never maintain at scale.
The Intelligent Suite transforms how organizations process the qualitative feedback that contains the richest satisfaction intelligence:
Intelligent Cell analyzes individual open-ended responses as they arrive — extracting sentiment, identifying satisfaction drivers, categorizing themes, and flagging escalation signals. Instead of 500 unread comments, you get structured driver analysis: "47% cite response time, 32% cite feature gaps, 21% cite onboarding."
Intelligent Row creates comprehensive customer satisfaction profiles — combining quantitative scores with qualitative themes across all touchpoints for each individual customer. When you see a customer's satisfaction declining, the profile shows exactly which experiences drove the decline.
Intelligent Column finds patterns across your entire customer base — correlating satisfaction drivers with outcomes, identifying which themes appear before churn, and revealing segment-specific satisfaction patterns that aggregate scoring masks.
Intelligent Grid generates comprehensive satisfaction reports through plain-English instructions. Ask "What are the top satisfaction drivers among customers who renewed vs. those who churned?" and receive a structured analysis in minutes, not weeks.
Connected measurement treats every new data point as an update to evolving understanding rather than an isolated snapshot. Customer satisfaction records grow richer over time — each interaction adding context, each survey response building on what came before.
This creates compounding intelligence. By month three, you don't just know current satisfaction levels — you understand trajectories, can predict which customers are heading toward churn based on driver patterns, and can validate which interventions actually improved satisfaction for similar customer segments.
A B2B software company collects CSAT after onboarding (day 30), after each support interaction, and at the 90-day mark. Intelligent Cell extracts themes from open-ended responses revealing that onboarding friction drives 62% of low scores. Intelligent Column correlates this finding with retention data, showing customers who flag onboarding issues are 3.4x more likely to churn within 6 months.
The team redesigns onboarding based on specific friction points identified in qualitative analysis — not general assumptions about what might be wrong. Churn drops 23% in the following quarter. Crucially, continuous measurement validates the improvement in real time rather than waiting for the next quarterly review.
A wealth management firm captures client satisfaction after advisory sessions and quarterly reviews. Intelligent Grid analysis reveals a counterintuitive finding: service recovery quality matters more than avoiding problems entirely. Clients who experienced issues that were resolved excellently rated satisfaction higher than clients who experienced no issues at all.
This insight shifts training focus from error prevention to response excellence, improving overall satisfaction scores by 12 points. Without AI-powered qualitative analysis connecting recovery narratives to satisfaction outcomes, this pattern would have remained invisible in aggregate NPS data.
A community services nonprofit surveys beneficiaries at program entry, midpoint, and completion — all linked by unique participant IDs. Intelligent Column reveals that early-program satisfaction with staff responsiveness predicts completion rates more strongly than satisfaction with program content.
This finding redirects resource allocation toward staff availability during the critical first 30 days. Completion rates improve 18%, and Intelligent Grid generates funder-ready reports connecting satisfaction trends to outcome evidence — securing 40% more renewal funding.
Identify every natural moment where customers interact with your organization. Post-purchase, post-support, onboarding milestones, renewal conversations, feature launches. These are your continuous feedback opportunities — replacing quarterly survey blasts with embedded measurement.
At each touchpoint, collect both quantitative ratings and qualitative context. A satisfaction score plus one open-ended question ("Why did you give this rating?") produces more actionable intelligence than a 20-question survey with only rating scales. The open-ended response is where AI-powered analysis creates the most value.
Ensure every feedback interaction links to a persistent customer identity. This is the architectural foundation that makes everything else possible — connecting surveys across time, linking satisfaction to behavior, and building cumulative customer profiles.
Use Intelligent Cell to extract drivers from open-ended responses automatically. Configure plain-English prompts for the analysis you need: "Categorize each response by satisfaction driver (support, product, pricing, onboarding). Rate sentiment on a 1-5 scale. Flag any responses indicating churn risk."
Link satisfaction data to behavioral metrics — retention, expansion, referrals — through shared customer IDs. Validate which satisfaction drivers actually predict the outcomes you care about. This step transforms satisfaction measurement from opinion tracking to predictive intelligence.
Use unique customer links to follow up proactively — reaching out to customers who flagged specific issues, sharing improvements made based on their feedback, and validating whether changes actually increased their satisfaction. This transforms one-way data collection into ongoing dialogue.
★ See How Intelligent Grid Analyzes Satisfaction Data in Minutes
View Live Satisfaction Report →
Watch how clean data collection → Intelligent Grid → plain English instructions → instant report → shareable live link transforms satisfaction analysis from weeks to minutes.
NPS and CSAT scores tell you whether customers are satisfied but not why, which makes them useful for tracking trends but useless for driving improvement. When NPS drops, the number alone can't tell you which experiences failed, which customer segments drove the decline, or what actions would help. These metrics become actionable only when connected to qualitative context that explains the scores through AI-powered analysis like Intelligent Cell, which extracts structured satisfaction drivers from open-ended feedback automatically.
The frequency question misframes the problem — satisfaction shouldn't be measured as periodic events but rather tracked continuously through natural customer touchpoints. Instead of quarterly surveys disrupting customers, build feedback workflows integrated into actual interactions: post-purchase, post-support, milestone check-ins, and renewal conversations. This natural integration captures satisfaction when it's most relevant while building longitudinal understanding without over-surveying customers.
Manual qualitative analysis doesn't scale to satisfaction measurement timelines and volumes — processing 500 open-ended responses through traditional coding takes weeks. Teams skim representative quotes, run basic word clouds, and present themes based on analyst intuition rather than systematic analysis because traditional tools can't process qualitative feedback efficiently. AI-powered analysis through Intelligent Cell changes this completely by extracting structured themes from every response automatically as feedback arrives, making qualitative depth achievable at quantitative scale.
Validation requires connecting satisfaction data to behavioral data through shared customer identifiers, then analyzing correlations between satisfaction metrics and outcomes like retention, referrals, or expansion. Most organizations skip this validation, assuming satisfaction predicts behavior without confirming it. Implementing unified customer IDs that connect surveys to behavioral records makes this analysis straightforward and often reveals surprising insights — like satisfaction volatility mattering more than satisfaction levels for predicting churn.
Yes, because the sophistication lives in platform architecture rather than team capabilities. Small teams don't need data scientists to extract themes, statisticians to identify drivers, or developers to connect data. Platforms designed for clean satisfaction measurement handle unique ID management automatically, process qualitative analysis through plain-English instructions, and generate intelligence through AI rather than analyst hours — shifting technical complexity from team requirement to platform capability.
Traditional satisfaction measurement treats feedback as episodic: collect scores quarterly, analyze after collection closes, present findings, plan improvements, repeat next quarter. Continuous learning means every new satisfaction data point enriches existing understanding rather than creating isolated snapshots — customers update evolving satisfaction records as experiences change, analysis happens in real time rather than waiting for survey close, and knowledge compounds over time instead of resetting each quarter.
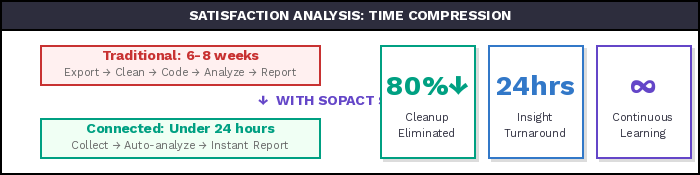
Connected measurement eliminates the 80% of work that happens after data collection: manual data export and cleaning, matching qualitative responses to quantitative scores, coding open-ended feedback for themes, and creating reports from disconnected sources. With unified customer IDs, automatic qualitative extraction through Intelligent Cell, and instant report generation via Intelligent Grid, teams move from weeks of manual work to minutes of AI-powered analysis while achieving deeper insights.
Clean-at-source satisfaction data means every customer gets a unique ID from first contact, every satisfaction touchpoint references this persistent ID automatically, and qualitative context connects to quantitative scores through shared data architecture. This prevents the fragmentation that creates 80% of downstream work — no duplicate customer records, no manual matching of responses across surveys, no disconnected feedback requiring integration. The data stays connected, complete, and analysis-ready from the moment customers provide feedback.
Effective feedback loops require unique customer links that enable proactive follow-up: reaching out to customers who flagged specific issues, requesting clarification about ambiguous responses, sharing improvements that resulted from their feedback, and validating whether changes actually increased their satisfaction. This transforms satisfaction measurement from one-way data collection to ongoing dialogue, showing customers their feedback visibly influences their experience rather than disappearing into dashboards.
The specific metrics that predict retention vary by business, which is why connecting satisfaction to behavioral data through unified customer IDs matters so much. Common patterns include satisfaction volatility predicting churn better than satisfaction levels, specific driver mentions (like implementation concerns) appearing 60-90 days before churn decisions, and early-stage satisfaction scores predicting long-term retention more strongly than later measurements. Only by analyzing your own satisfaction-behavior correlations can you identify which metrics deserve focus in your context.