What are monitoring and evaluation tools?
Monitoring and evaluation tools are the forms, field apps, spreadsheets, databases, analysis software and reporting systems a team uses to track delivery and judge outcomes; the ones worth choosing keep every result traceable to the participant records it came from.
An M&E team often runs several already: KoboToolbox or ODK in the field, spreadsheets and Power BI for analysis, NVivo for interviews. The harder choice is where each participant's continuing record lives, who governs it and what AI may read.
THE SHORT VERSION
- Six systems with no shared ID and no owner produce zero trust, so the donor report takes weeks and monitoring turns into a year-end compilation.
- A data warehouse can join those systems, but it is built for a data engineering team that a small M&E unit does not have.
- Govern data where it is born, with one ID at the first form and every later wave on that record, so monitoring runs all year and each reported figure opens to its records.
Why do six M&E systems add up to zero trust?
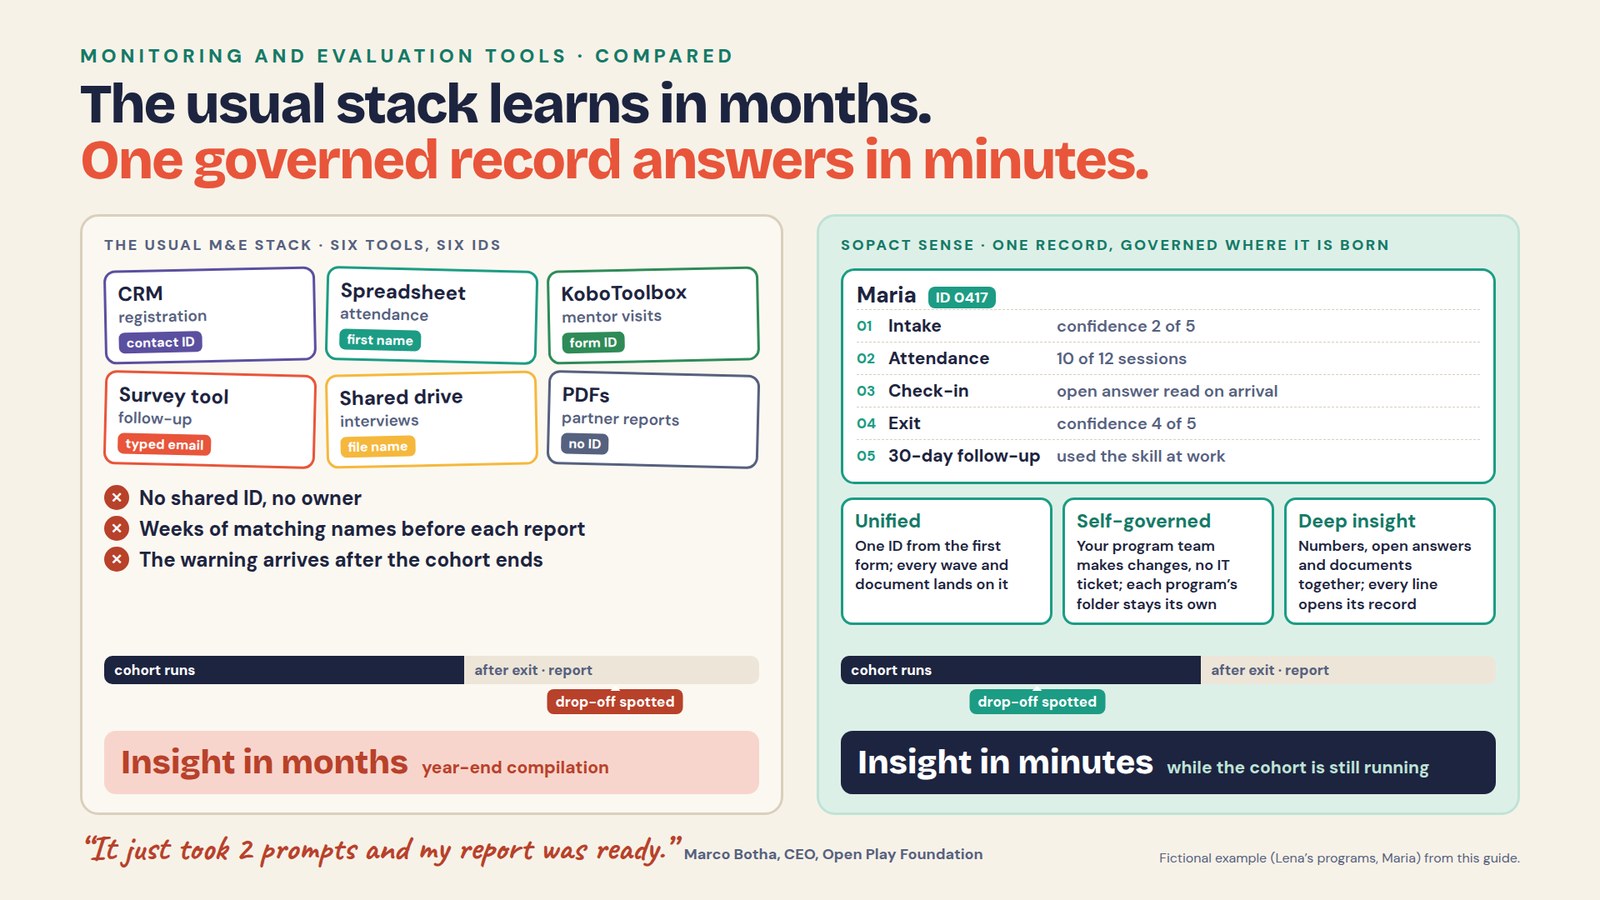
Each system holds part of the evidence under its own identifier and nobody owns the whole, so every answer that crosses programs starts with weeks of matching. Take Lena, a fictional M&E lead with three programs: skills training for employers, mentoring for young entrepreneurs, and savings groups run with two partner organizations.
Registration sits in a CRM, attendance in spreadsheets, mentor visits in KoboToolbox, follow-up in a survey tool, interviews in a shared drive and partner reports in PDFs. The donor report is due next month and asks a fair question: which participants used what they learned, and what got in the way?
The CRM knows a contact ID, the attendance sheet a first name and the survey a typed email. Each tool did its job well, but with no shared ID from the first form, Lena spends the weeks before the deadline matching names and reading PDFs.
The same export shows several training learners stopped attending halfway through. The cohort has already finished, so the warning can go into the report but can no longer change delivery. That is how monitoring becomes a compilation exercise instead of learning while the team can still act.
Pasting the exports into ChatGPT or Copilot does not repair this: the same file can return two different answers, and names and emails travel into the chat. Lesson 1 of the Foundations course explains why.
Does an M&E team need a data warehouse?
Usually not to start: a warehouse can pipe the CRM, surveys, sheets and files into one store, but it needs data engineers to build the pipelines, model the tables and keep both running. An M&E unit of two or three evaluators is not that team. When a form changes, a pipe goes stale, and the next donor question ends up back in a spreadsheet.
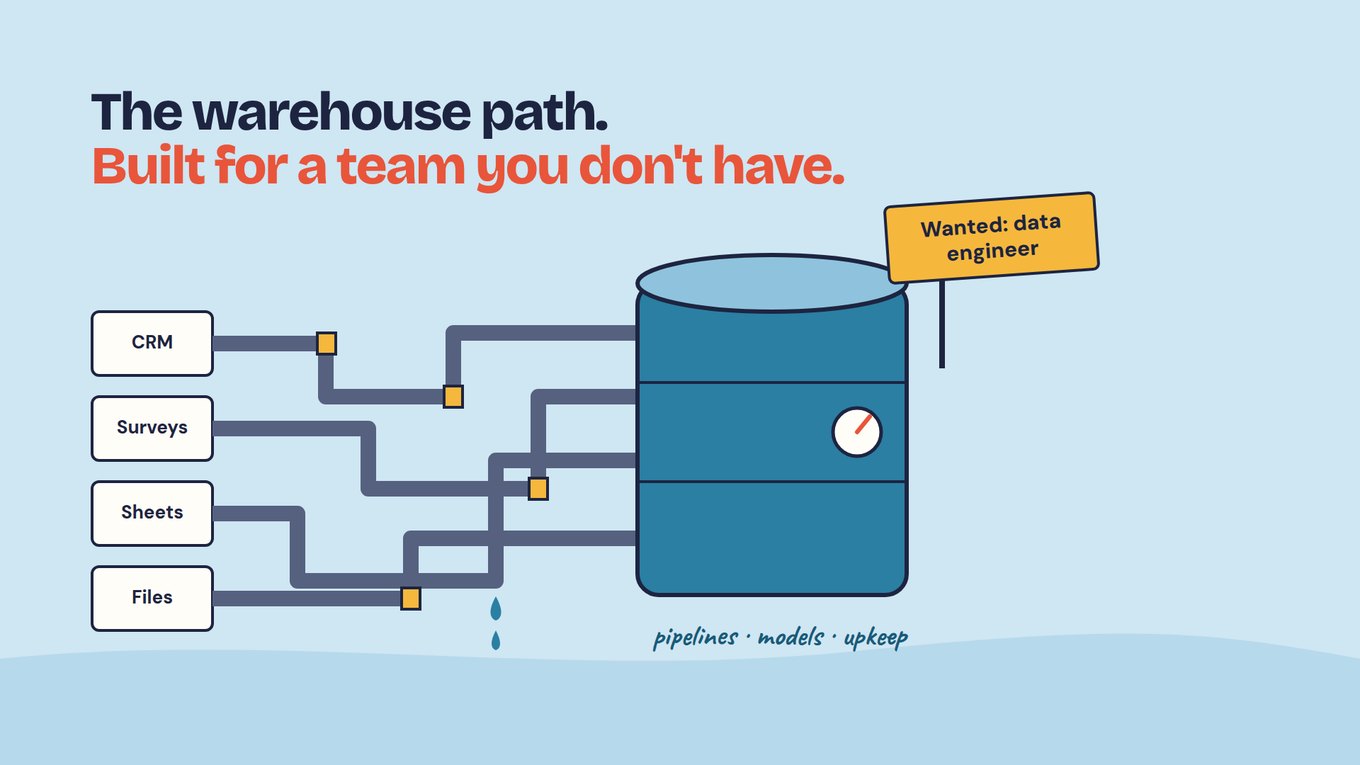
Power BI and other dashboards stay valuable for questions designed in advance. The weak point is timing: a warehouse reconciles data collected without a shared ID, so the matching moves into the pipeline instead of going away. An AI assistant on top changes how answers look, not how trustworthy the records are.
What changes when M&E data is governed where it is born?
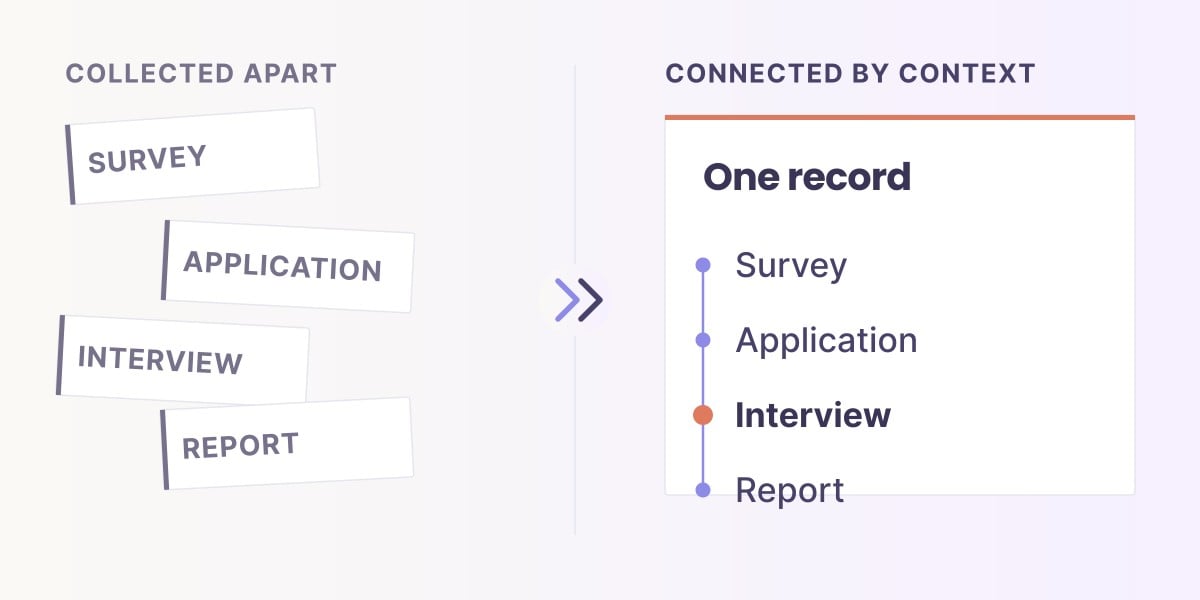
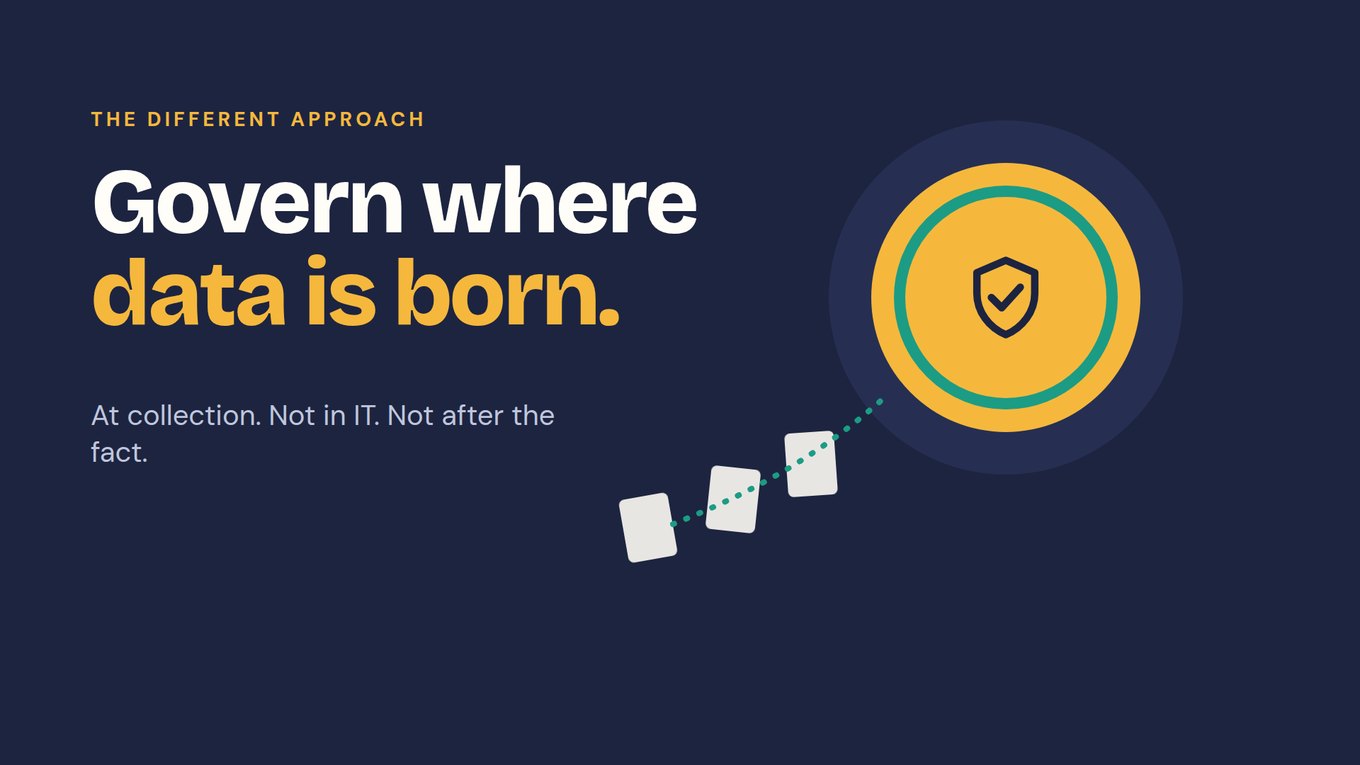
Each participant gets a unique ID at the first form, and every later wave, note and document lands on that same record, so data is centralized as it is collected and the program team governs it without an IT ticket. There is nothing to merge at report time because nothing was ever split.
Here is Lena's year reworked; the training numbers come from the Foundations course example.
LENA'S THREE PROGRAMS, GOVERNED · FICTIONAL
At intake. Each program's registration form becomes its first form, and every participant gets an ID there. Each program works in its own folder, where the AI Assistant sees only that program's data; Lena, as organization owner, sees results across all three.
Mid-cohort. The training check-in lands on the same IDs, and its open answers are read on arrival with a prompt Lena configured. Learners missing sessions show up while the cohort is running, with reasons in their own words, so the coordinator adjusts delivery before exit.
After exit. The 30-day follow-up joins the same records: of 40 training completers, 25 answered (62.5%), and 15 of those used the skill at work (60% of respondents). Ten did not, and the 15 who stayed silent count as unknown, not as no.
Report time. The donor question becomes one query in each program’s folder, with the combined results in Lena’s owner view. Maria (ID 0417) reads as one line: confidence 2 of 5 at intake and 4 at exit, 10 of 12 sessions, a mentor note about leading a mock interview, and the skill used on the job at 30 days.
Monitoring and evaluation now read the same records on different clocks: attendance gaps during delivery, skill use 30 days after exit. Neither needs a new export, and every line of the answer opens the record it came from.
A real case: Open Play Foundation runs four sports facilities in Stellenbosch, South Africa. Once its data was connected, a water leak surfaced in real time and ten program reports became one funder submission.
Evaluation judgment stays with people: the 15 silent learners are a gap in the evidence, not a finding, and 30-day use is self-reported. Attributing change to the training needs a comparison group planned in advance, and your evaluator checks each AI-drafted claim against the records. Lesson 5, Measure change, covers coverage and unknowns.
Watch: a theory of change used between reports
Continuous monitoring depends on an outcome framework the team uses during delivery, not one filed with the proposal. Watch for how each outcome connects to a decision made while the program runs, and ask whether your tools could feed it without an export.
How do M&E tools compare on ID, governance and AI?
Every category below does real work well, so compare them on what decides trust: whether one ID holds across waves and sources, who governs the setup, and what AI sees. Field products do more than isolated submissions: ActivityInfo documents relational records, beneficiary tracking and offline workflows, and ODK Entities supports linking data across forms and time.
| Tool and what it does well | One ID across waves and sources | Who governs it | What AI sees |
|---|---|---|---|
| KoboToolbox, ODK, SurveyCTO: offline and mobile field collection, form logic | Linking across forms is possible (ODK Entities); you maintain the links | Whoever builds the forms and linking rules | Whatever you export |
| ActivityInfo: relational records, beneficiary tracking, offline work | Beneficiary tracking is documented; test it on a second wave | Whoever configures the database | Test which fields leave or reach AI |
| Survey and panel platforms: survey design, panels, distribution | Repeated waves work when configured; program records often sit elsewhere | The platform administrator | Open-answer summaries inside their own surveys |
| Excel and Google Sheets: small, controlled workflows | Matched by typed name or email; attrition checks are manual | Whoever has the file | Whatever gets pasted, names included |
| Warehouse with Power BI or dashboards: large structured datasets, recurring views | Reconciled in pipelines after collection | Data engineers | The modeled tables |
| NVivo, MAXQDA, ATLAS.ti: deep coding of interviews and documents | One study at a time; linking to later waves takes extra work | The researcher on the project | The corpus you import |
| CRMs and case systems: identity and service workflow | Contacts keep IDs; qualitative outcome evidence needs another layer | The admin or consultant | An add-on reads whatever the CRM holds |
| Document repositories: storing and searching files | Files are not tied to program measures by themselves | Whoever manages the drive | Files, apart from the record or indicator |
| ChatGPT or Copilot on exports: flexible questions, quick summaries | None; it sees the file you give it | No one; no approved definitions or permissions | Everything pasted in |
| Sopact Sense: numbers, open answers and documents on one record per participant | Persistent unique ID from the first form; later waves attach | Your program team, without an IT ticket | Only the fields and surveys you select; answers link to records |
Read the rows as demo questions, not a ranking. Sopact Sense is not the deepest offline form engine, an academic coding workspace, a finance system or a full case-management system of record; where one of those is your main job, choose the specialist.
What should you test in M&E software before you buy?
Bring one real workflow with a baseline, a delivery measure, an open-ended answer, a partner document and a follow-up, and have the person who will run the tool do every step.
Start with governance: have your program lead change a question, launch a follow-up and correct an error without a consultant, then ask who does it after they leave. Next, change one participant's email between waves and add a late follow-up; everything should open from one record, with the missing wave shown as missing.
Then test the evidence. Ask why an indicator moved and require each theme to open to its quotes and respondents, and ask a finding to cite a passage from a specific partner report.
Finish with AI. Ask the same question twice, ask for a participant's email address, and check which surveys and fields each answer used. Rebuild one reported number by hand: counts should match exactly, and every line should open the records behind it.
Can you keep the M&E tools you already use?
Yes: keep the specialist tools that do a clear job well, and decide where the continuing record about each participant lives. A field team may keep KoboToolbox or ODK, a research team may keep NVivo and leadership may keep Power BI. What matters is that the ID, definitions, dates and source references survive each handoff; otherwise the report still depends on manual reconstruction.
Across programs or sites, do not impose one form on everyone. Agree the few core measures that must roll up, write down each one's unit, denominator, dates and missing-value rule, and let programs keep local questions (see Many programs, one picture).
Context management, a shared place for those definitions that the Assistant can use, is coming soon to Sopact Sense. Until then, keep the definitions in a document your team owns and log each change.
Start with one program and its next report
Pick the program whose report is due next, run one delivery cycle on governed records, and let the report come out of that cycle instead of a separate compilation. For Lena, that was the training program.
- Write the donor question for one cohort, and define who counts, such as who is a completer.
- Make intake the first form, where every participant gets a unique ID; name one owner on the program team.
- Add a mid-program check-in on the same IDs, with one open question about what is getting in the way.
- Add the exit survey and a 30-day follow-up to the same records, and report non-response as unknown.
- Decide what AI may see: pick the surveys in scope and keep names, emails and phone numbers out.
- Answer and trace: open three records behind the answer, and note any step that still needed an export; that is the next workflow to add.
After one cycle you should hold a monitoring signal the team acted on during delivery, a donor answer with its coverage and unknowns stated, and the records behind each claim.
Frequently asked questions
What are monitoring and evaluation tools?
They are the software used to define indicators, collect evidence, monitor delivery, evaluate outcomes and report findings, from field apps and spreadsheets to qualitative analysis software and BI tools. What separates them is whether a participant keeps one ID across every wave, who governs the setup, and whether a reported figure opens to its records.
What are the best M&E tools?
It depends on the job. KoboToolbox, ODK and SurveyCTO are strong for field collection; spreadsheets and BI tools for structured analysis; NVivo, MAXQDA and ATLAS.ti for deep qualitative coding. Sopact Sense fits teams that collect all year and need numbers, open answers and documents on one record per participant, governed by the program team.
What is the difference between monitoring tools and evaluation tools?
Monitoring tools follow delivery, reach, quality and early warning signs while a program runs. Evaluation tools examine outcomes and change over time, often after exit. They work on different clocks but should read the same evidence: when attendance, check-ins, exit surveys and follow-up share one ID, both come from the same records instead of two reconciled exports.
Can a spreadsheet be an M&E tool?
Yes, for a small, controlled workflow. It becomes fragile when several people edit copies, participants must be matched across files by name or email, open text needs analysis, or the same evidence must support several reports. The formulas also leave with whoever built them, a governance problem before a technical one.
Do you need a data warehouse for monitoring and evaluation?
Not to start. A warehouse joins data after collection and needs data engineers to build and maintain its pipelines and models. A small M&E team gets more from one ID at the first form with every later wave on that record, so data arrives connected, and any warehouse built later gets cleaner input.
How should AI be used in monitoring and evaluation?
Use AI to read open answers and documents on arrival and to answer plain-language questions over records your team already governs. Keep names, emails and phone numbers out of what it reads, limit it to the surveys you choose, and require every answer to link to its records. A person reviews any conclusion before it reaches a donor.