What should a social impact report include?
Explain the activity and the people it is intended to benefit before presenting the results. Give the reader enough context to judge the significance of a finding.
- Purpose and scope: the social issue, population, location and reporting period.
- Activities and reach: what was delivered and who participated.
- Observed outcomes: changes in circumstances, capabilities, experience or well-being.
- Distribution: differences between groups, including who was not reached.
- Participant perspectives: feedback that explains how people experienced the work.
- Evidence and limits: methods, response rates, missing information and alternative explanations.
- Decisions: the actions the findings support and what will be assessed next.
The scope may be a nonprofit program, a business’s community activities or an investment portfolio. Define that boundary explicitly. A program report does not automatically describe an organization’s full social effects.
Distinguish outputs, outcomes and causal claims
Outputs describe delivery, such as workshops held or support sessions completed. Outcomes describe changes, such as sustained employment, improved skills or a reported change in well-being. Outputs show whether the work happened; they do not by themselves establish its effect.
Observed change also does not automatically prove causation. Participants’ circumstances, other services and wider economic conditions may contribute. Explain the evaluation method and the strength of the evidence. Use an appropriate causal design when the question requires attribution; otherwise describe the observed results and the contribution the evidence can support.
Qualitative feedback adds explanation. It can reveal an unexpected barrier or benefit that a predefined questionnaire missed. Treat it as evidence with a source and scope, rather than selecting one positive quote to represent everybody.
Social impact report example: employment and access
Fictional example. A workforce program supports 100 people. Eighty complete training; 50 completers answer a three-month follow-up and 30 of those respondents report paid employment.
Main finding
Thirty of 50 follow-up respondents reported paid employment. The report can state 60% of respondents; it cannot state that 60% of all 100 participants found work.
What the overall figure misses
Among respondents, 24 of 35 people without reported caring responsibilities were employed, compared with 6 of 15 people with caring responsibilities. These small groups warrant investigation. The difference does not establish that caring responsibilities caused the employment gap.
What participant feedback adds
Several respondents described difficulty accepting shifts that conflicted with care arrangements. This suggests a practical question for the program: would more flexible employer partnerships improve access?
Response and follow-up
The team will discuss scheduling with participants and employers, improve follow-up coverage and review the next cohort. The report records that decision and its rationale, without presenting a proposed change as an achieved outcome.
A report like this does more than publish a headline rate. It shows whom the program may be underserving and the next question worth investigating.
Choose a framework that fits the reporting purpose
A theory of change can explain how activities are expected to contribute to outcomes and which assumptions need testing. Specific reporting references should then fit the organization and its audience. Naming a framework is not evidence of impact.
For corporate reporting, GRI Standards address organizational impacts on the economy, environment and people. Applying relevant disclosures involves defining the reporting boundary and the topics that matter; a short community-program report alone does not establish compliance.
For an impact-investment audience, the mandate may call for investment-specific indicators or frameworks. Use the agreed definitions and explain what they cover. Do not impose investment measures on a nonprofit service or CSR program simply because they appear in another report.
The video illustrates several impact-investment and program references. Choose only those relevant to your report’s purpose; it is not a universal list of required standards.
Use AI to investigate patterns without losing context
AI can help organize themes across interviews, open-ended survey responses and program notes. It can also help compare those themes with quantitative results and prepare an audience-specific explanation. Before using a finding, inspect the underlying evidence and consider who is missing from it.
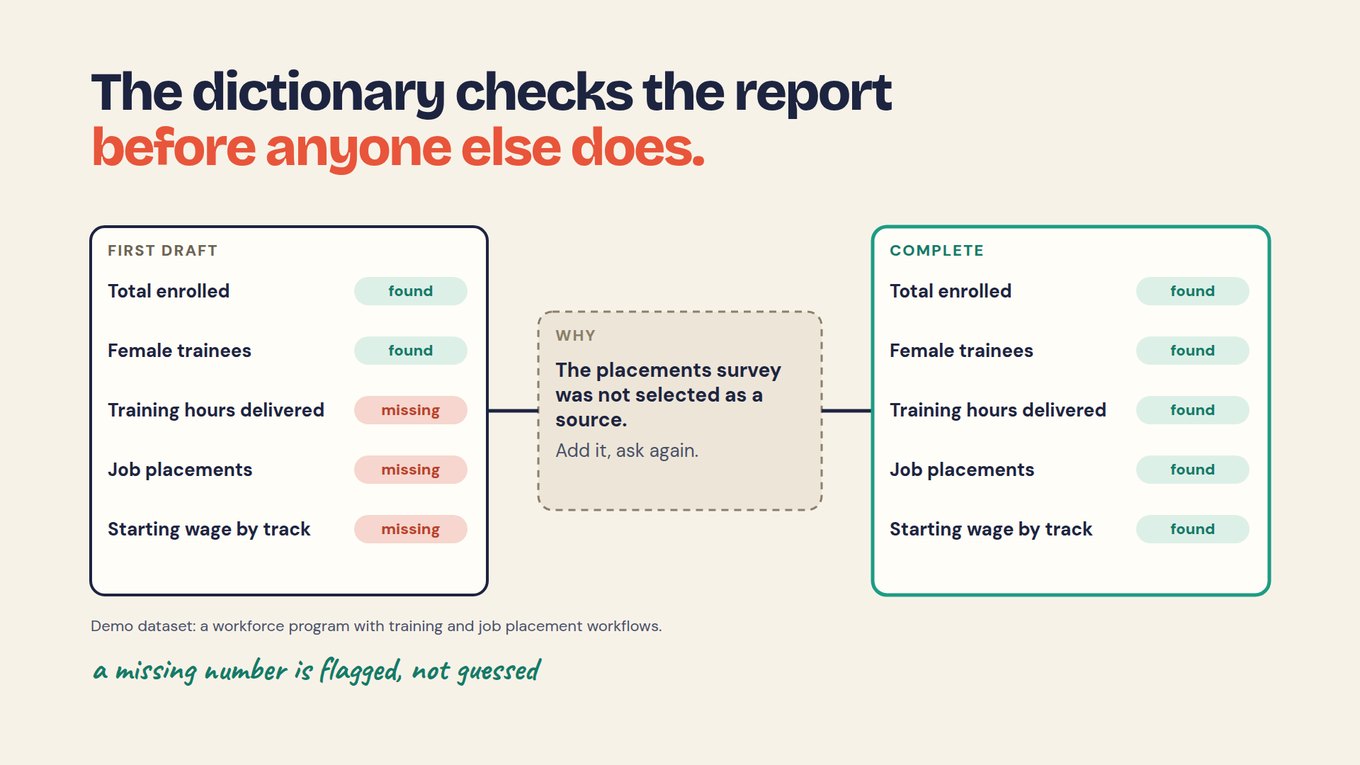
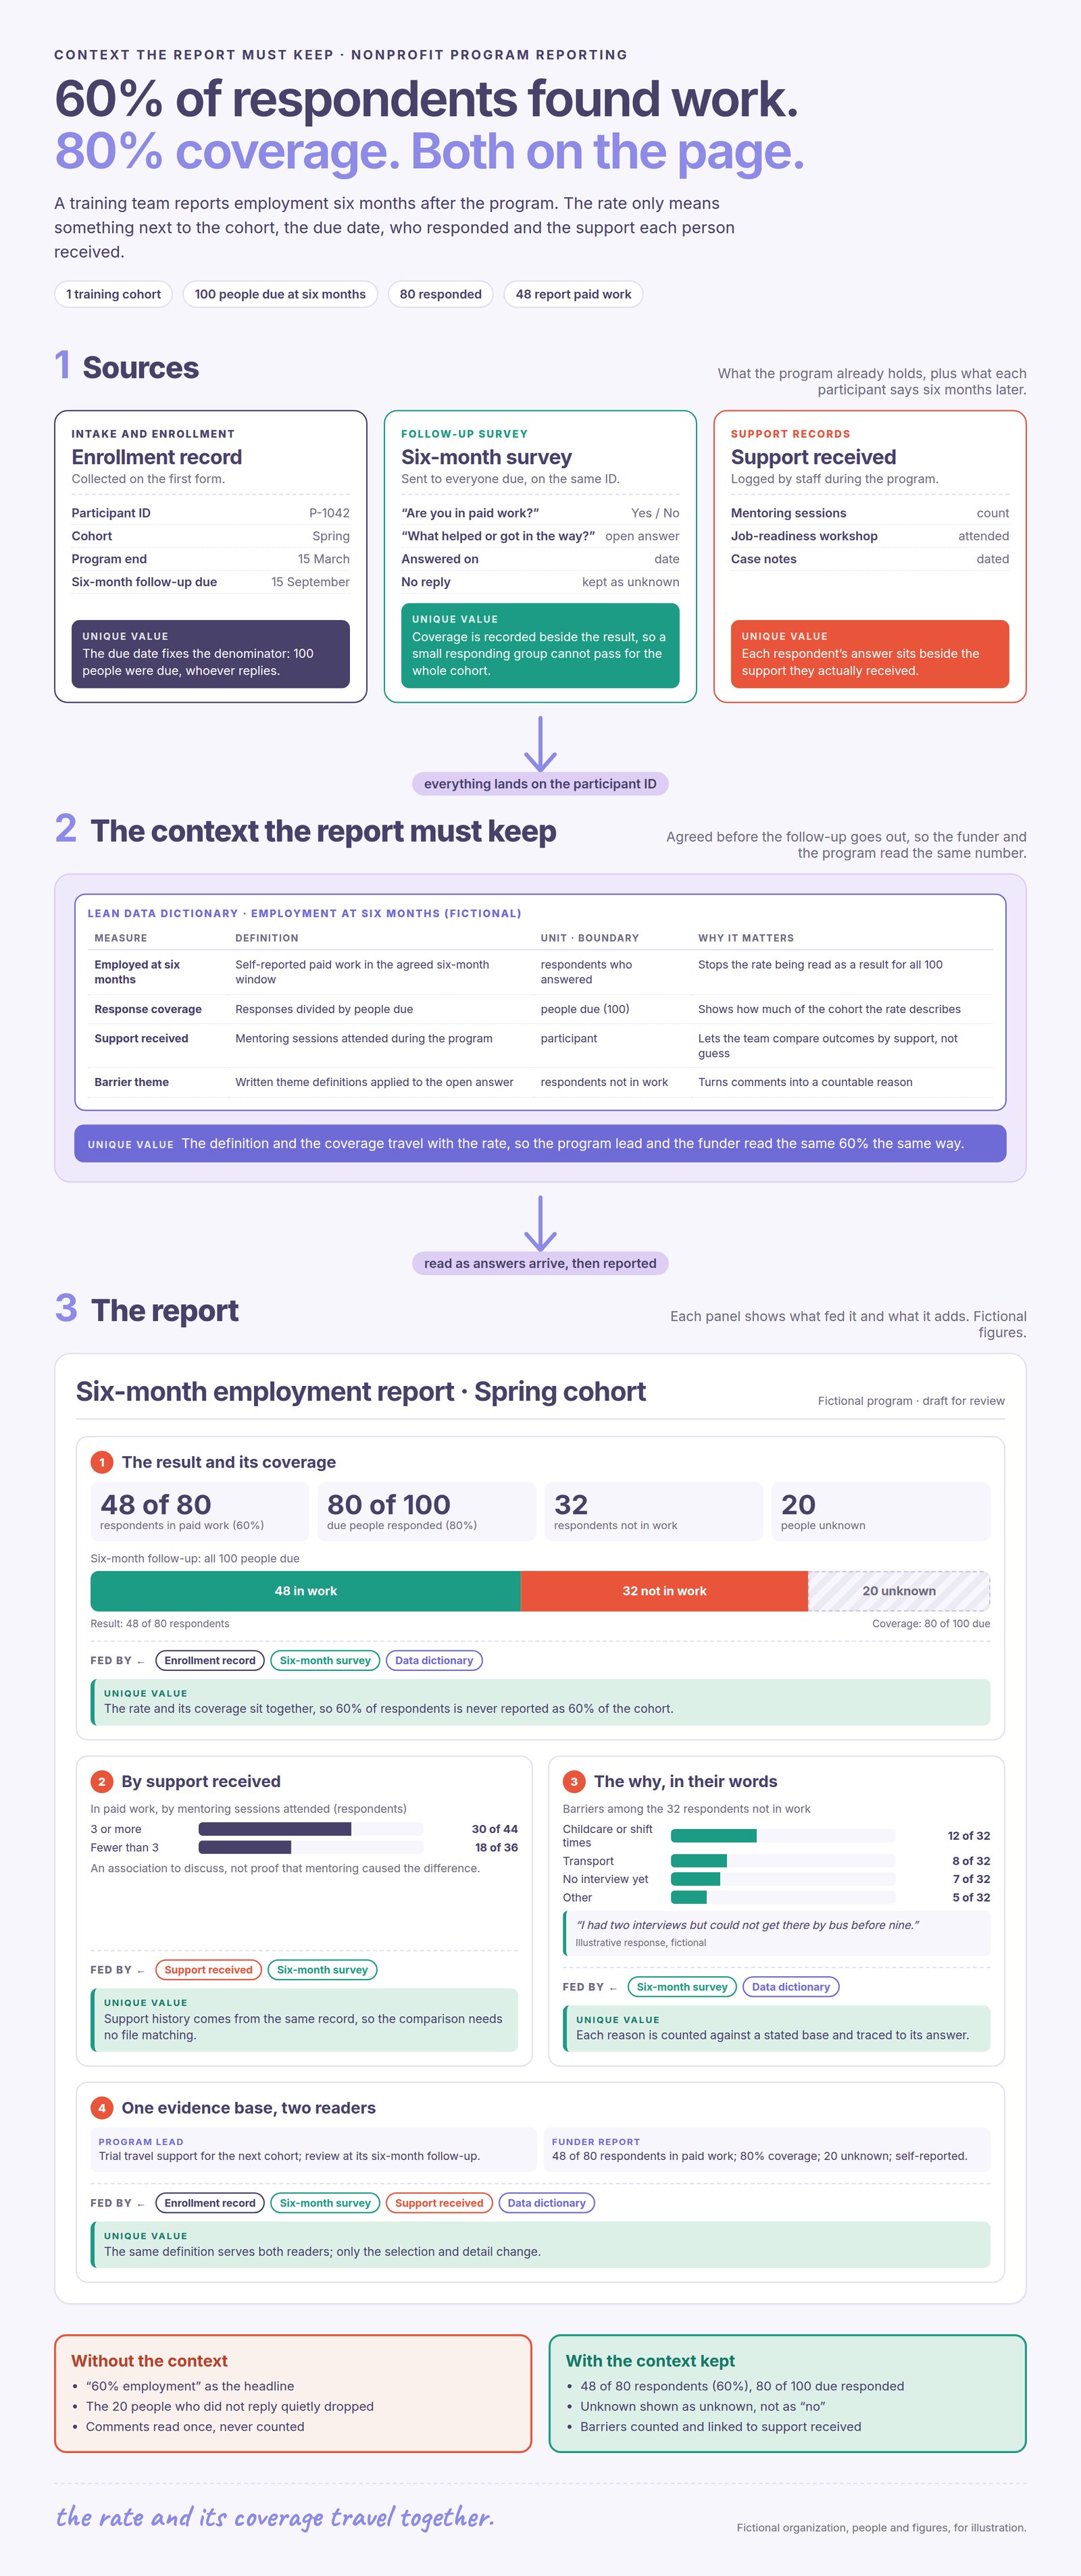
A practical data dictionary should define the reporting unit, population, period, calculation, source and any aggregation rule. “Employed at follow-up,” for example, needs a follow-up interval and an employment definition. A change in either can make results from two years unsuitable for direct comparison.
Here is an employment report whose dictionary fixes those terms: employment is measured at six months among respondents, and response coverage of everyone due for follow-up sits beside the rate.
Sopact connects this evidence and context across programs and portfolios. Incoming analysis supports ongoing staff questions, while program history helps explain the findings used in a report. Human review remains important for interpreting differences, protecting sensitive information and deciding how to act.
Turn the findings into a useful report
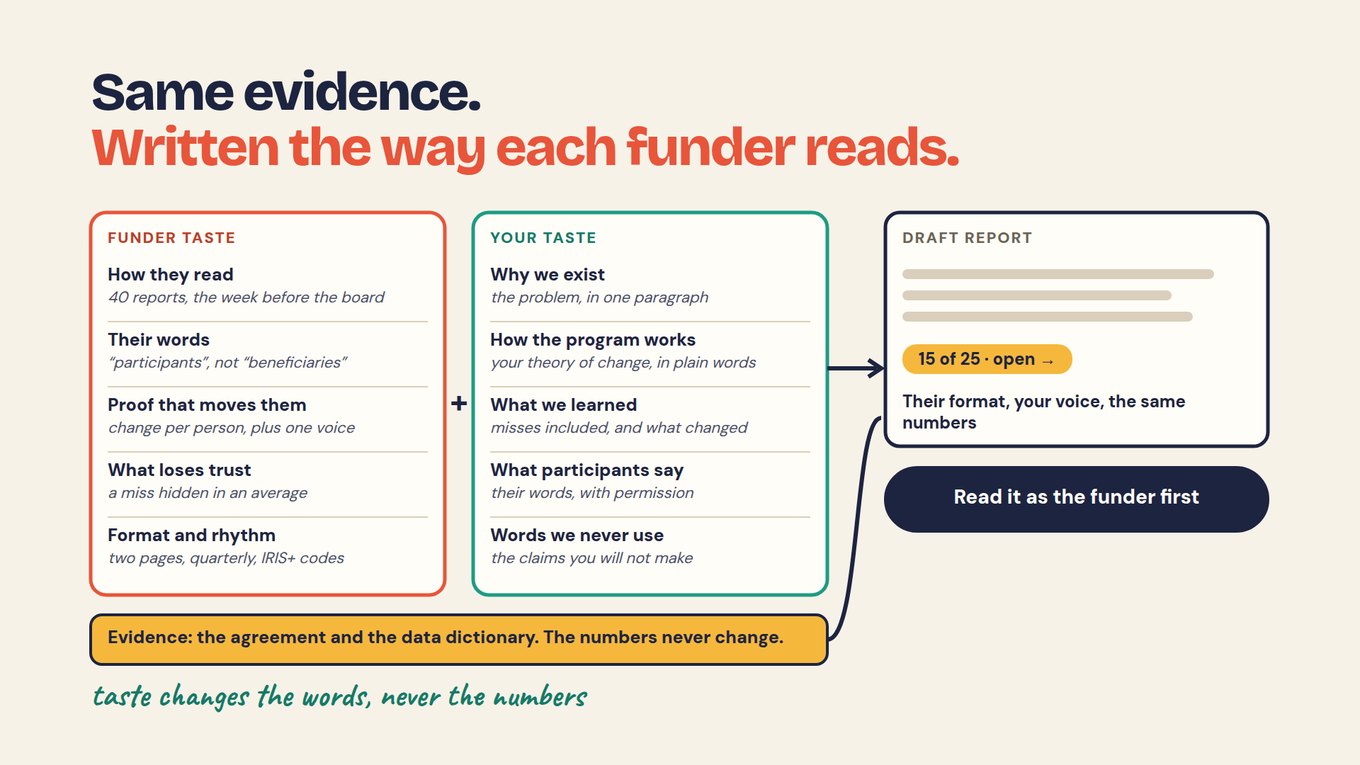
Lead with a small number of meaningful results and explain their implications. Pair each with the population, period, evidence and uncertainty needed to interpret it. Use the impact report template to structure the report, the nonprofit impact report guide for organization-wide results, or the impact reporting guide for other reporting contexts.
Frequently asked questions
Is a social impact report the same as a sustainability report?
They overlap, but their scope can differ. A social impact report concentrates on effects on people and communities. Sustainability reporting may cover wider environmental, social and economic impacts and other disclosure requirements.
Can we report a positive outcome without proving causation?
Yes, if the wording accurately describes the observation and its limits. State the evidence and method, acknowledge alternative explanations and avoid claiming that the activity caused the result without adequate support.
Should negative findings appear in the report?
Relevant negative and unintended effects belong in a credible account of the work. Explain what was observed, whose experience it represents and how the organization is responding.
How should participant quotes be used?
Use real, appropriately consented quotations that clarify a finding. Explain the relevant context and avoid implying that one person’s experience represents the whole population.