play icon for videos

How to Build a Nonprofit Impact Report Across Programs

Report reach, outcomes and learning across programs without double-counting people or losing the evidence behind the results.

Updated
September 15, 2026
360 feedback training evaluation
Use Case

USE CASE / PRACTICAL GUIDE

How to Build a Nonprofit Impact Report Across Programs

Report reach, outcomes and learning across programs without double-counting people or losing the evidence behind the results.

13 min readBy Unmesh Sheth · Updated September 11, 2026

What is a nonprofit impact report?

A nonprofit impact report explains the results of an organization's work, who or what experienced those results, the evidence behind them and what the organization will change next. It can bring several programs together without pretending that all their outcomes can be reduced to one total.

An organization-wide report needs a clear boundary: the programs, locations and period it covers. Some nonprofits work with individuals; others support households, organizations, communities or environmental change. Choose measures that fit the work. A count of unique people can be important, but it is not the universal definition of reach or impact.

The hard part often happens before writing. Program teams use different definitions, one person may appear in several records, documents sit outside the reporting spreadsheet, and the board asks a different question from a funder. A readable report explains these differences instead of hiding them behind a single headline.

This guide focuses on reporting across programs. For the document outline, use the impact report template. For the broader evidence and review process, see impact reporting.

What should a nonprofit impact report include?

Give readers a short summary, then enough detail to judge the findings. The following views are useful building blocks; adapt them to the organization's purpose and reporting commitments.

Questions an organization-wide report should answer
ViewReader's questionEvidence to include
Purpose and scopeWhat change is the organization trying to support?Intended outcomes, programs, places, period and exclusions.
Reach and deliveryWho or what was reached?Defined units, coverage, program participation and overlap.
Outcomes by programWhat changed, and for whom?Measures, comparisons, denominators and limitations.
People's experiencesWhat explains or challenges the numbers?Reviewed themes and permitted quotations, including negative findings.
Change over timeAre results improving or changing?Comparable periods, consistent definitions and disclosed changes.
Stewardship and learningWhat did the organization learn and decide?Relevant resource use, risks, actions, owners and review dates.

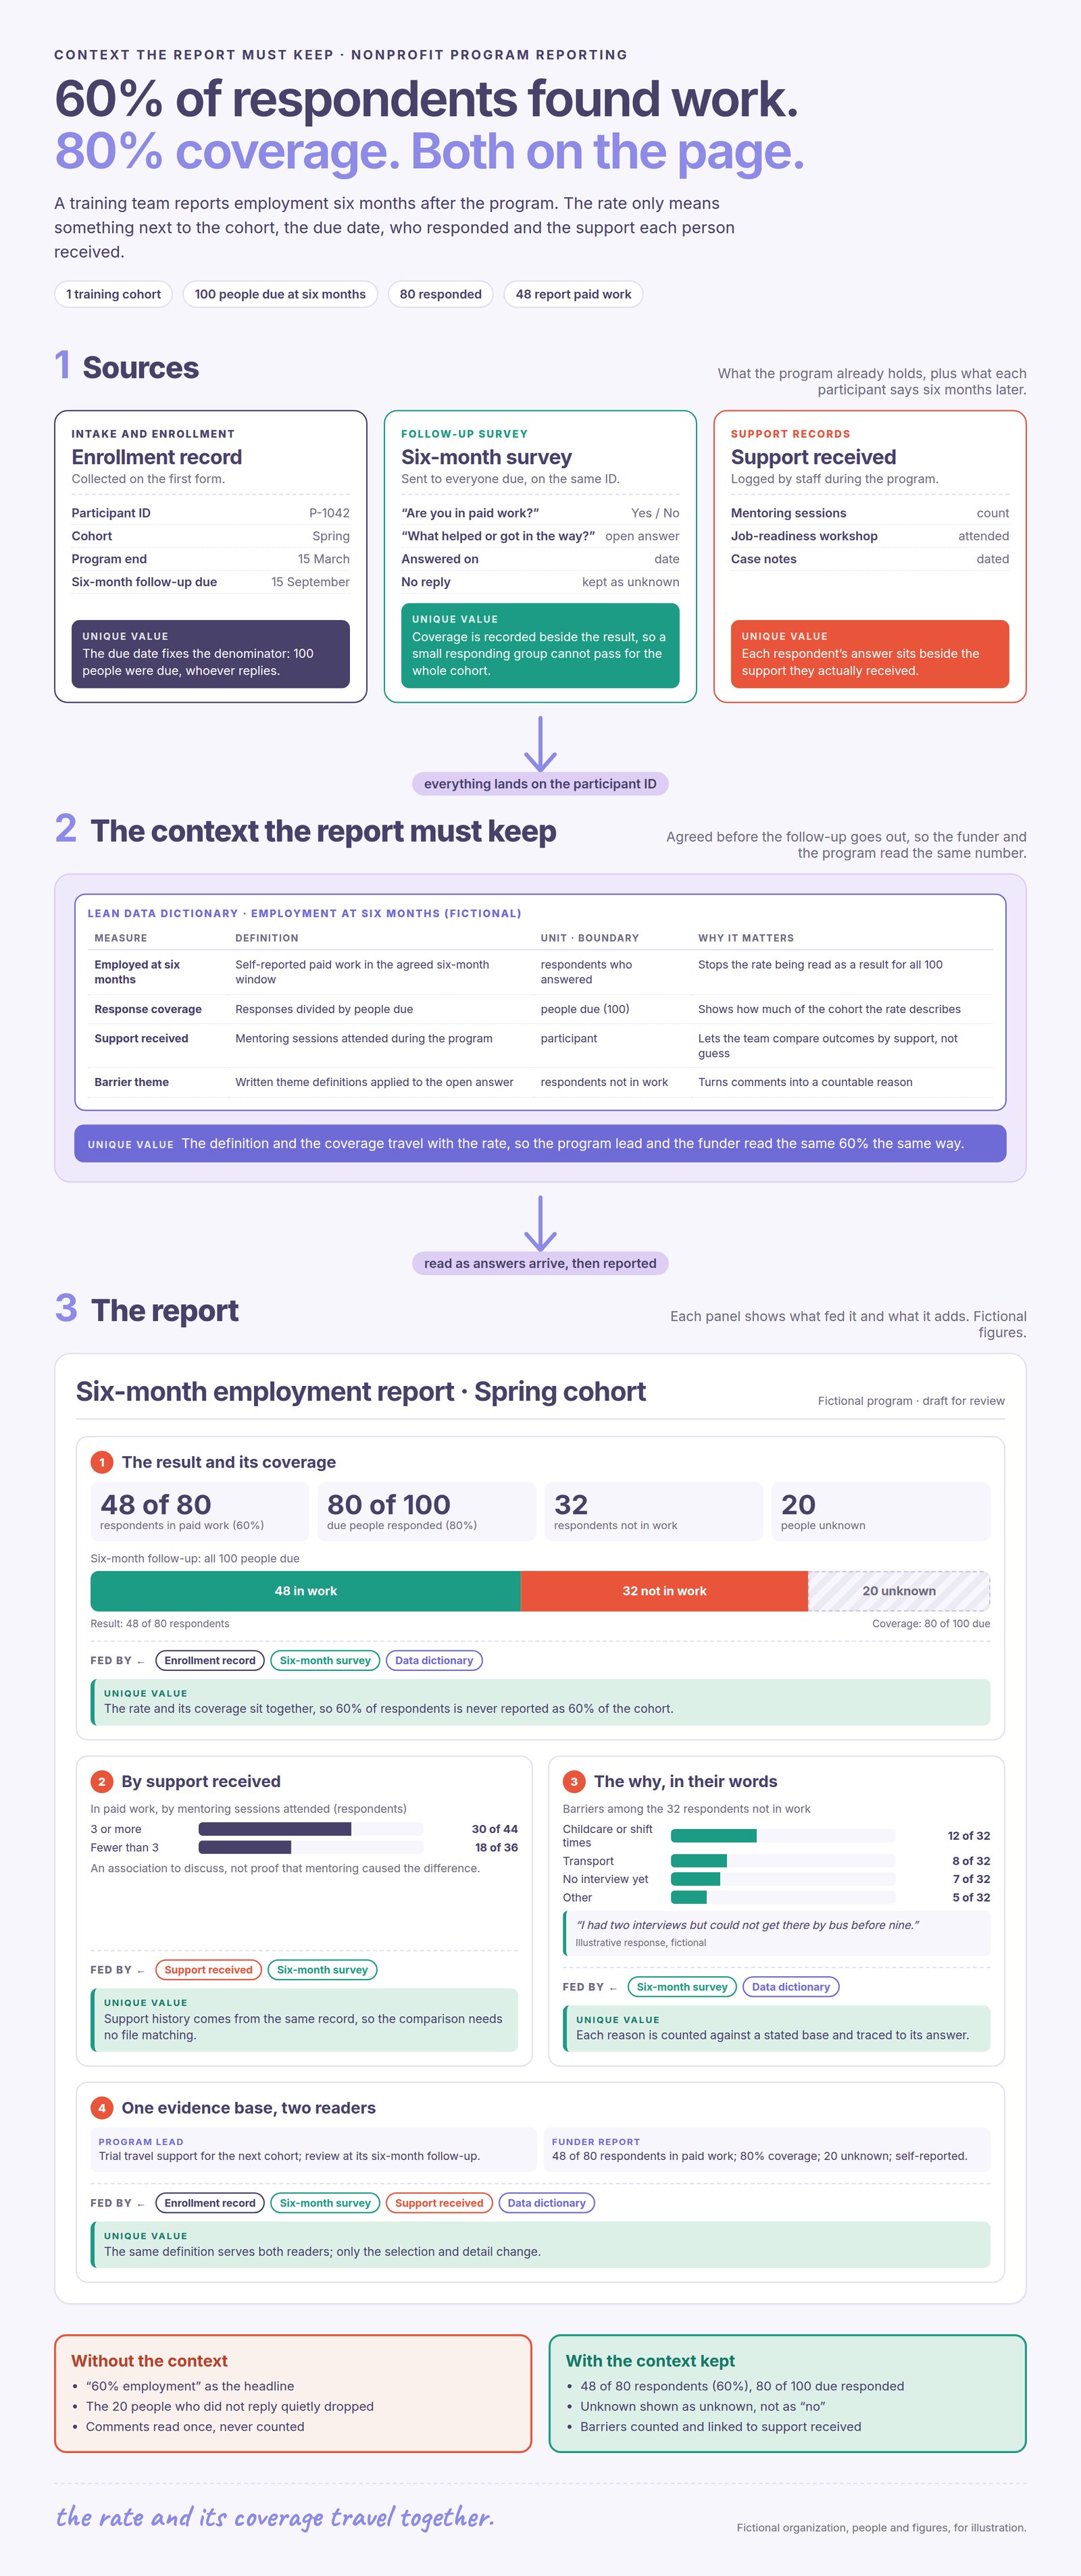
Do not reserve every limitation for an appendix. If a headline covers only respondents or excludes a program, say so beside it. Detailed definitions and calculations can sit in an appendix or controlled evidence record.

Get the guide: How to Write an Impact Report →
Browse report examples and dashboards →

Count reach without confusing visits, enrollments and people

Decide what each count represents before combining program reports. A service visit is an event. An enrollment is participation in a program. A unique-person count describes distinct individuals within a defined boundary and period. All three can be useful, but they answer different questions.

Illustrative example: a food-support program serves 80 people and a training program serves 60. Twenty people participate in both. Together the programs have 140 program participations and serve 120 unique people: 80 + 60 − 20. If the food program records 300 visits, those visits should be reported as visits, not added to the people count.

Two program counts do not automatically equal total reach
  • 80 peopleFood-support program
  • 60 peopleTraining program
  • 20 peopleParticipated in both
  • 120 unique people80 + 60 − 20 within the same reporting period

Illustrative figures. The program participation total remains 140; the unique-person total is 120. Neither number measures outcomes.

For three or more programs, do not simply subtract each pairwise overlap: people appearing in three programs can then be removed more than once. Count distinct eligible identities across the combined records, using an appropriate matching method.

If the organization cannot reliably identify overlap, report the program totals separately and state that they are not deduplicated across programs. An honest boundary is preferable to an unsupported organization-wide total.

Connect records while keeping program histories intact

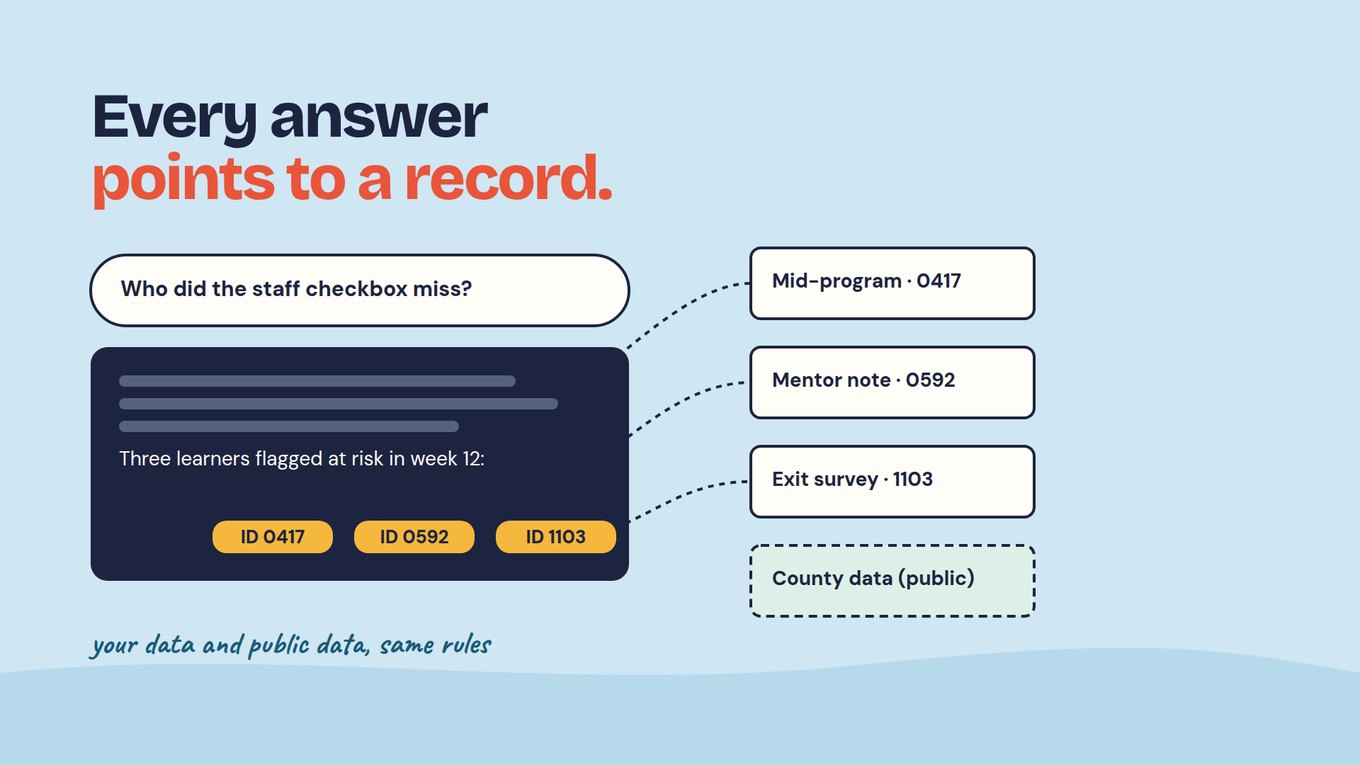
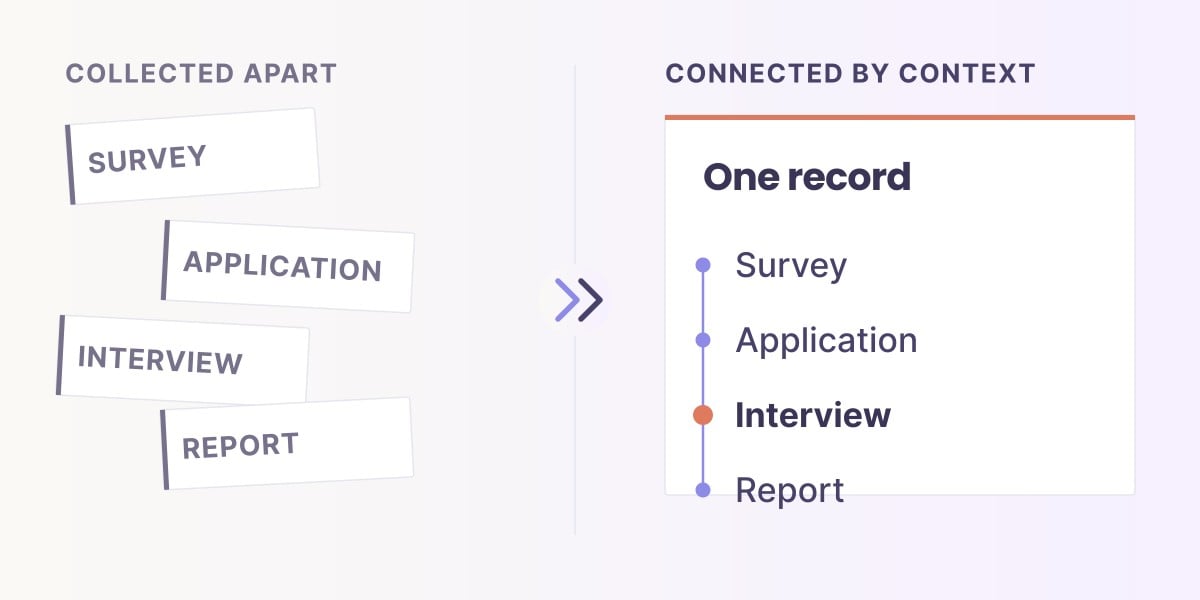
A shared identifier can help link an authorized person's records across programs and reporting periods. Keep each enrollment, service event and follow-up attached to its program and date. One person can have several program histories; combining identities should not collapse those histories into one undated record.

A data dictionary defines fields and counting rules. It does not resolve identity by itself. Teams also need a matching process, checks for duplicate or mistaken matches, and a way to review exceptions. Email addresses and names can change or be shared, so neither should be treated as a universally reliable identifier.

Only link information where the organization's permissions and purpose allow it. Some surveys intentionally protect anonymity; some programs need separation between sensitive records. In those situations, use the appropriate aggregate analysis and explain the limits on cross-program conclusions.

Keep the source, program, observation date, reporting period and record owner with each submission or document. A revised file should have a version or change history. These details let a reviewer distinguish a new result from a corrected old one.

Before rollout, test a small set of records with program staff: one person in one program, one in several programs, a duplicate, a withdrawn enrollment and an unresolved match. Confirm both the organization-wide count and the program-level histories.

Choose shared metrics without erasing program differences

Start with the intended outcomes of each program and the decisions readers need to make. Identify which measures are genuinely shared and which should remain program-specific. Two teams using the label “completion” may apply different rules; two employment measures may use different follow-up windows.

For each material measure, record its definition, unit, eligible population, calculation, source, collection timing, missing-data rule, owner and version. Check these details before aggregating results. Where definitions differ, keep results separate or explain a justified recalculation.

A shared organizational outcome can bring different contributions together in a narrative without requiring an artificial total. A housing program and a training program may both support stability, but stable housing and employment are different outcomes. Show each measure clearly and explain the proposed relationship.

External metric catalogs or a funder's framework can guide the definitions you need. Record which definition and version you used, any adaptations, and why the measure fits the work. A framework label does not establish the quality of the underlying evidence.

Show outcomes with coverage and an honest comparison

Report what was observed, the relevant population and when it was measured. Distinguish activities and outputs from outcomes. Completing training is a delivery result; entering suitable work is a different outcome. Explaining the program's contribution requires more evidence than showing that employment followed training.

Illustrative continuation: 45 of the training program's 60 participants respond at follow-up, and 30 respondents report employment. Report 30 of 45 respondents, or about 67%, alongside the 75% follow-up coverage. Do not describe 67% as the employment rate of all 60 participants. The employment status of the other 15 is unknown.

A baseline or previous period is useful only when the population, timing and definition support the comparison. Say whether the analysis follows the same people or compares different cohorts. Explain changes in eligibility, program delivery or measurement that could affect interpretation.

People using multiple programs may differ from those using only one before receiving support. A difference between those groups is an association; it does not, by itself, show that receiving more programs caused a better outcome. Use the finding to frame a question and choose a suitable evaluation approach.

Use participant voices to explain and challenge the numbers

Interviews, open-ended survey responses and case notes can reveal barriers that a headline measure misses. Examine the breadth of the evidence before choosing a quotation. Look for recurring themes, differing experiences and accounts that contradict the dominant explanation.

Keep each quotation in context: who could contribute, when the account was collected, how themes were identified and what permission covers its use. A vivid story illustrates an experience; it does not establish how common that experience was or prove an aggregate result.

Where it is appropriate and permitted to connect qualitative and quantitative information, examine whether the same themes appear among different outcome groups. If the feedback is anonymous, preserve that anonymity and work at the level the data supports. Avoid implying individual linkage that does not exist.

For public reporting, remove unnecessary identifying details and consider whether combinations of details could identify a person. Authorized reviewers may need a controlled source trail, while public readers need an understandable explanation of the method and its limits.

Keep annual trends comparable and audience views consistent

Retain approved reporting snapshots so a published annual figure does not silently change when the underlying records are updated. Preserve the definition version, included records, calculation and approval date. Disclose corrections or restatements when they affect a previously reported result.

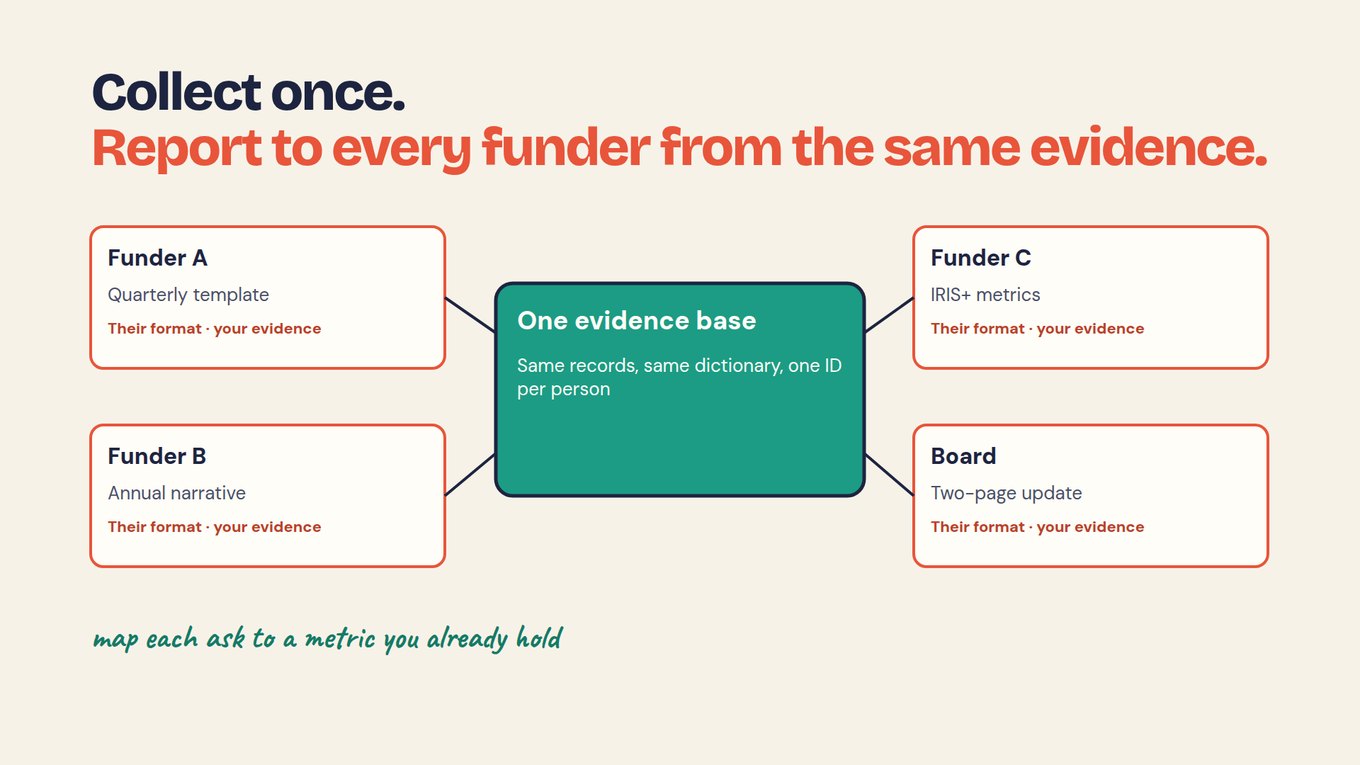
Use a board version to foreground decisions, resources and risk; a funder version to address the relevant award and requirements; and a public version to explain the work in accessible language. These can share approved evidence while differing in scope and detail.

Different views may legitimately show different totals. A funder report might cover one award from April to March, while the annual report covers the whole organization from January to December. Label those boundaries and reconcile the difference rather than forcing the totals to match.

Pair multi-year charts with notes about changes in population, definitions and delivery. When a series is no longer comparable, show a break or separate the periods. A smooth trend line is not worth a misleading comparison.

What AI can help with—and what still needs review

AI can help organize supplied documents, identify themes, suggest checks and draft a narrative from reviewed findings. Define the task and provide the relevant context: program, period, measure definitions and reporting requirements. Require source references and a way to inspect the evidence.

Review extracted values, calculations and interpretations. Treat a flag as a reason to investigate, not proof of an error. Do not ask an assistant to fill missing outcomes with plausible answers or convert an association into a causal claim.

Maintaining connected evidence can make recurring questions easier to answer: which programs lack follow-up, which definitions changed, or which participant accounts explain a delivery issue? The quality of the answer still depends on coverage, correct linkage, appropriate access and review.

Video companion · Use alongside the definitions, examples and limitations in this guide.

Customer practice: Open Play Foundation

Open Play Foundation's published story describes bringing operational and program evidence together, including facility activity, maintenance and water use. That mix is a useful reminder that a nonprofit's reporting data can extend well beyond a participant survey.

Marco Botha, CEO and co-founder, describes the work this way: “I'm digitizing our entire business through Sopact.” The relevant lesson is to maintain evidence during operations so it is available for decisions and reporting.

This customer story documents a data practice. It does not validate the illustrative overlap calculation above, establish cross-program causal impact, or show that every organization should use the same data structure.

Prepare the report and the next reporting cycle

Begin with one reporting period and a manageable set of material findings. Agree the scope, inventory the sources, resolve the important counting and definition questions, and assign a reviewer to each claim. Then write the summary and program sections from that reviewed evidence.

Before publication, follow a headline figure back to its source and calculation. Check coverage, duplication, permissions, financial context where relevant and whether the proposed action follows from the finding. Ask a reader outside the reporting team to explain what the headline means; revise it if the interpretation is wrong.

Continue through these practical resources:

  1. Agree one definition for every number before collecting the next cycle.
  2. Turn reporting requirements into evidence and assign source owners.
  3. Keep each result traceable to its evidence for review.

For teams managing recurring evidence across programs or partners, explore portfolio intelligence. Start with the reporting question and data your team needs to maintain.

Frequently asked questions

Is a nonprofit impact report the same as an annual report?

An annual report may cover governance, finances and organizational activity as well as impact. An impact report focuses on results, supporting evidence, limitations and learning. They can be combined if the different purposes remain clear.

How do we count people who use several programs?

Define the period and eligible population, then count distinct authorized identities across the relevant program records using a reviewed matching process. Retain each program history. If overlap cannot be resolved reliably, report program totals separately and state the limitation.

What if we work with households or organizations rather than individuals?

Use the unit that fits the work and label it clearly. Households, organizations, service visits and individuals are different units and should not be added together as one reach total.

Where can I find a nonprofit impact report example or template?

Use the linked report examples library for presentation ideas and the impact report template for a reusable document structure. Adapt the outline to your programs, evidence, audience and reporting obligations.

Can we combine results from different programs?

Combine them only when the measures, units, populations and periods support aggregation and overlap is addressed. Otherwise show program results separately and explain how they contribute to the broader purpose.

Does using several programs explain better outcomes?

A difference in outcomes between multi-program and single-program participants does not establish causality. The groups may differ in other ways. Interpret the association cautiously and choose an evaluation approach that can examine alternative explanations.

How often should a nonprofit publish an impact report?

Match publication to commitments and reader needs, often annually or quarterly. Review operational evidence more frequently where it can inform action, while retaining approved snapshots for formal reporting.

Put this into practice

Use the free course to turn the method into a collection, analysis and governance plan for your team.

Build a connected portfolio evidence plan →

For reporting examples and a writing guide: How to write an impact report · Explore report examples.

Watch on YouTube if playback is unavailable

Explore portfolio intelligence →